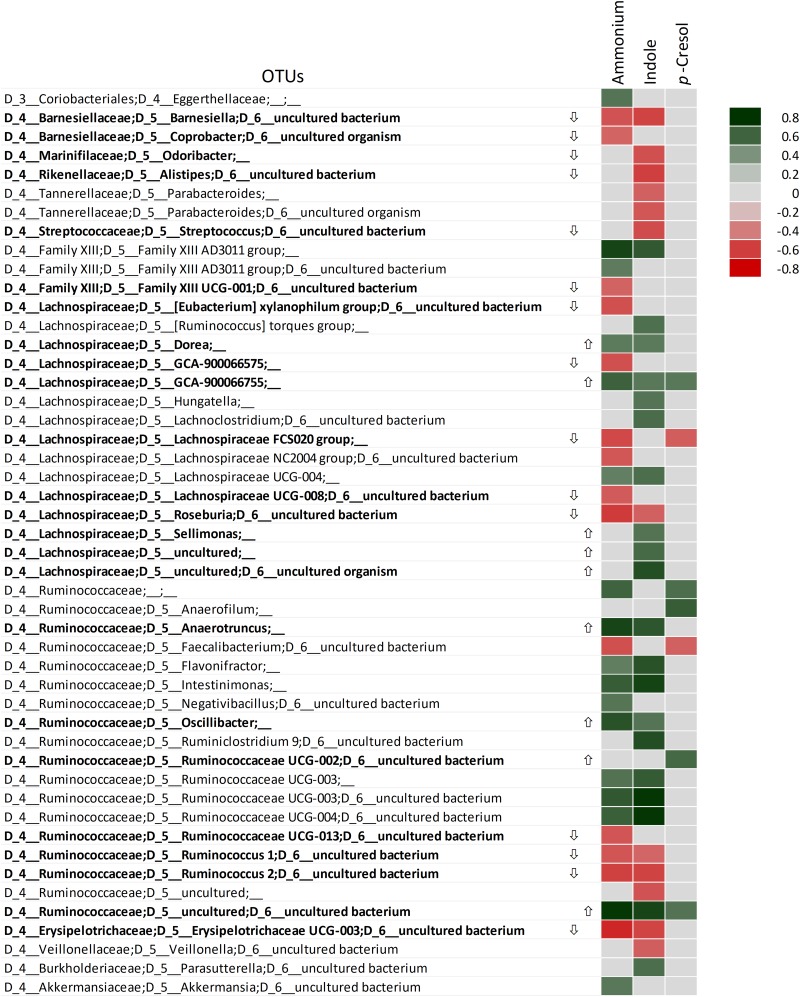
FIGURE 6.
Spearman’s rank correlation among the OTUs and ammonium, indole, and p-cresol. Only OTUs significantly correlating with at least one metabolite are displayed. Rho values are reported in the heatmap if statistically significant (P < 0.05), ranging from the deepest red (–1) to the deepest green (+1). The OTUs that were evidenced by LEfSe as biomarkers with significant increase ( ) or decrease (
 ) are in bold.

