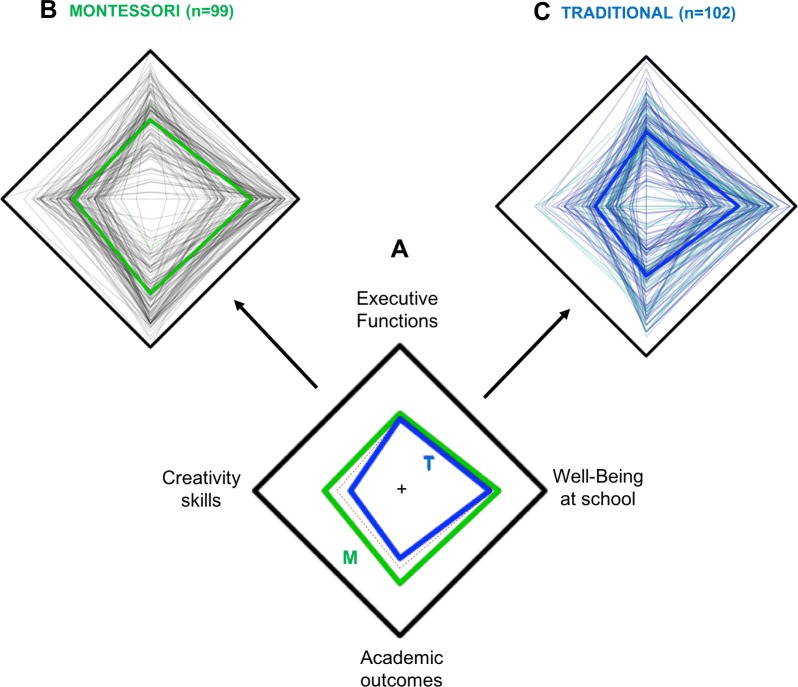
Fig 2. Radial qualitative representation of the four different cognitive measures: executive functions, creativity skills, well-being at school, and academic outcomes, each located at a summit.
The scales depend on the measured cognitive skill; however, all run from the minimum at the center to the maximum at the border of the square. Individual results are represented with a thin line (Montessori schoolchildren on top left 2B, and control on the top right 2C), and mean for each group is reported with a bold line in the central square 2A, where the dotted red line marks the 0 of each cognitive measure’s z-score scale. Montessori (M) depicted in green, traditional (T) in blue. Group differences (M vs. T) are observed for creativity skills and academic outcomes.

