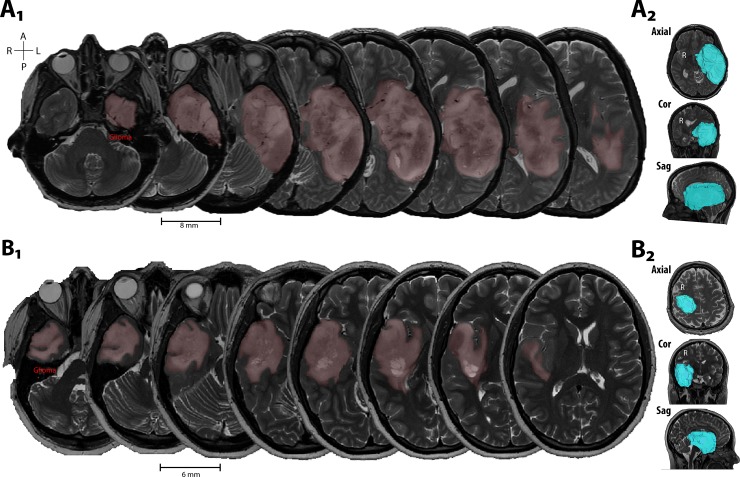
Fig 1. Examples of lesion volume segmentation and 3D rendering.
(A, B) Axial T2w image sets from two patients with glioma. Manually segmented regions of hyperintensity displayed in light red. Side panels show 3D rendering of segmented lesion volume (cyan) in the axial (Ax), coronal (Cor), and sagittal (Sag) planes.

