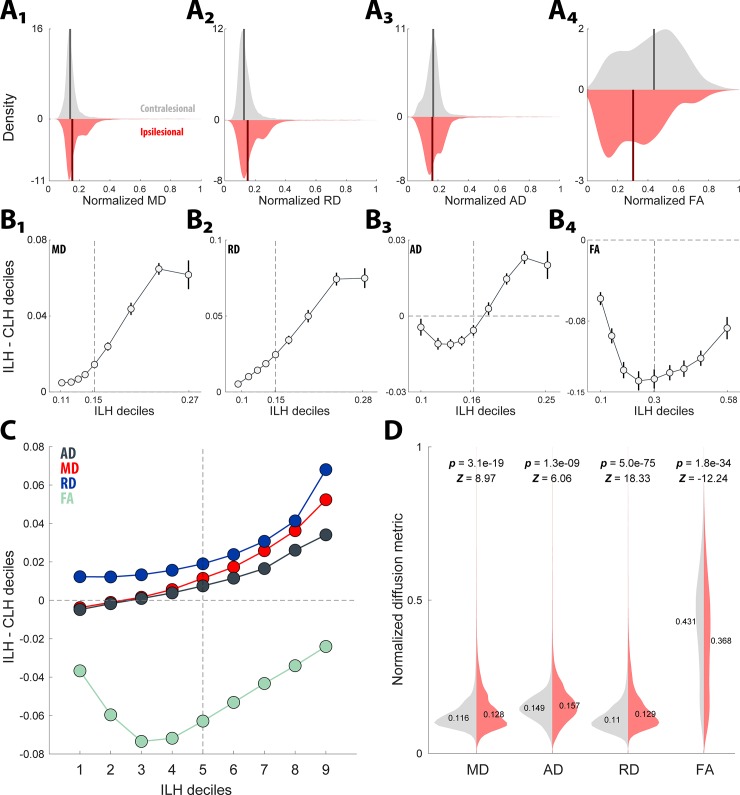
Fig 2. Hemispheric analysis of glioma impact on white matter.
(A1-4). Hemispheric differences in the diffusion coefficient distributions (1–4; MD, RD, AD, FA, respectively) depicted as mirrored probability distributions (red indicates ipsilesional and gray represents contralesional; solid vertical line represents the median) for a representative case. (B1-4) A shift function analysis was used to compare differences over the entire distribution, by comparing the offsets of estimated deciles between the distributions (ILH = ipsilesional hemisphere, CLH = contralesional hemisphere). B1-2, shift function curves indicate that for both the MD, RD distributions there is a positive shift for both tails (more pronounced for the right tail), suggesting that at all segments of the distribution those values are higher for the ipsilesional side. B3, the shift function curve for AD shows a negative shift up to the median and then a steeper positive shift in the right tail of the distribution, indicating that likely the positive values in the right tail dominate the distribution and suggest an overall positive skew. B4, shows a dramatic negative shift function curve for the FA, indicating that the ipsilesional hemisphere is composed of lower values along the distribution compared to the contralesional hemisphere. (C) Group data (n = 13) for the shift function analysis strongly replicates the representative case in A&B. (D) Non-parametric t-tests (Wilcoxon rank sum) applied to the hemispheric distributions for each diffusion coefficient resulted in significant differences supporting the shift function findings: the ipsilesional hemisphere exhibited higher MD (Z = 8.97, p = 3.1e-19), higher AD (Z = 6.06, p = 1.3e-9), higher RD (Z = 18.33, z = 5.03–75) and lower FA (Z = -12.24, p = 1.8e-34) compared to the contralesional hemisphere.

