
Fig 4. Mean diffusion coefficients along tractography varies when crossing the lesion volume.
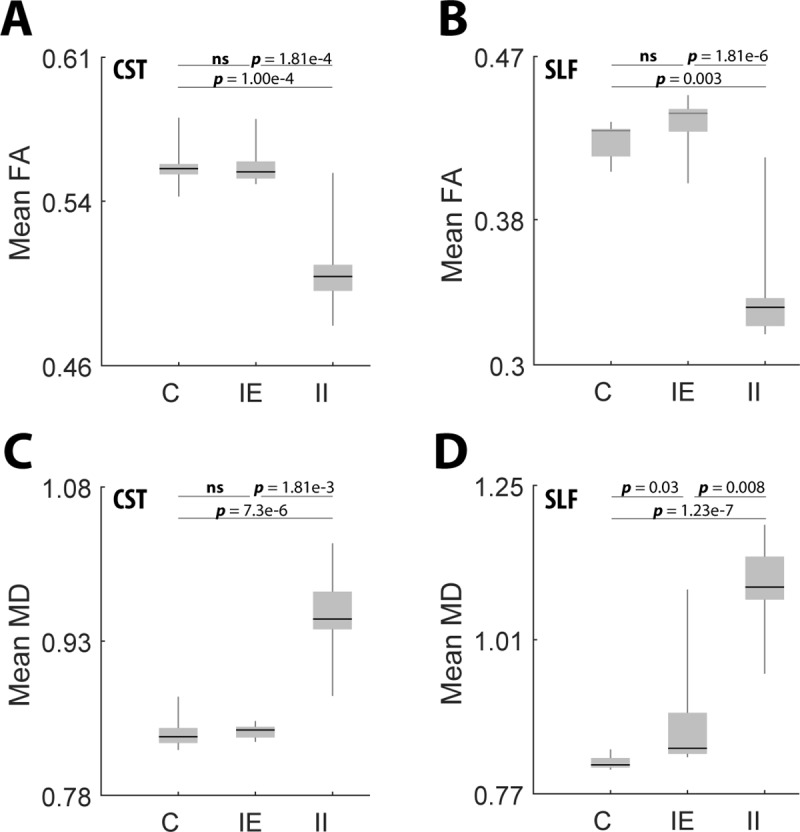
(A-D) Boxplots of mean diffusion coefficients along the CST and SLF grouped by C, IE, and II. P values for comparisons between groupings were calculated using post-hoc Dunn’s test analysis. Bars indicate the interquartile range.