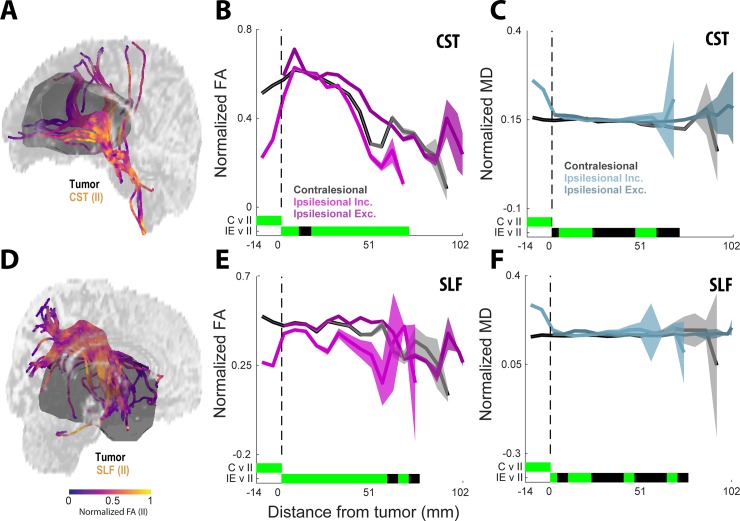
Fig 5. Diffusion coefficients along tractography influenced by proximity to lesion volume.
(A) An example showing normalized FA variation with proximity to lesion volume is depicted for the CST. (B) Normalized diffusion coefficients of FA C, IE, and II groups plotted against distance from lesion volume boundary (mm), respectively. Negative values indicate tract locations within the lesion volume. The solid lines represent diffusion means at binned distances from lesion volume boundary, the shaded areas represent 95% confidence intervals (CI). Locations of overlapping CI are represented by the bars at the bottom of the plots, green indicates non-overlapping CI and black indicates overlapping CI. (C) Same as in B, but for MD. (D) An example showing normalized FA variation with proximity to lesion volume is depicted for the SLF. (E, F) Same as in (B, C), but summarizing across group data for SLF.

