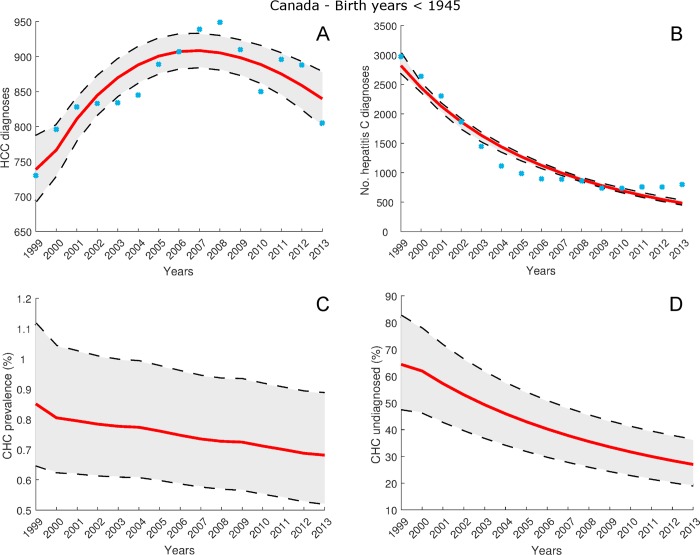
Fig 3. Estimates for cohort of individuals born before 1945, for years 1999–2013, from model (12), (13) calibrated using data listed in S4 Table and S5 Table.
Blue circles denote observed annual numbers of HCC and hepatitis C diagnoses for this cohort. A: Model estimates of total number of HCC diagnoses. B: Model estimates of total number of hepatitis C diagnoses. C: Model estimates of CHC prevalence rate Rx(t). D: Model estimates of proportion of CHC population undiagnosed .

