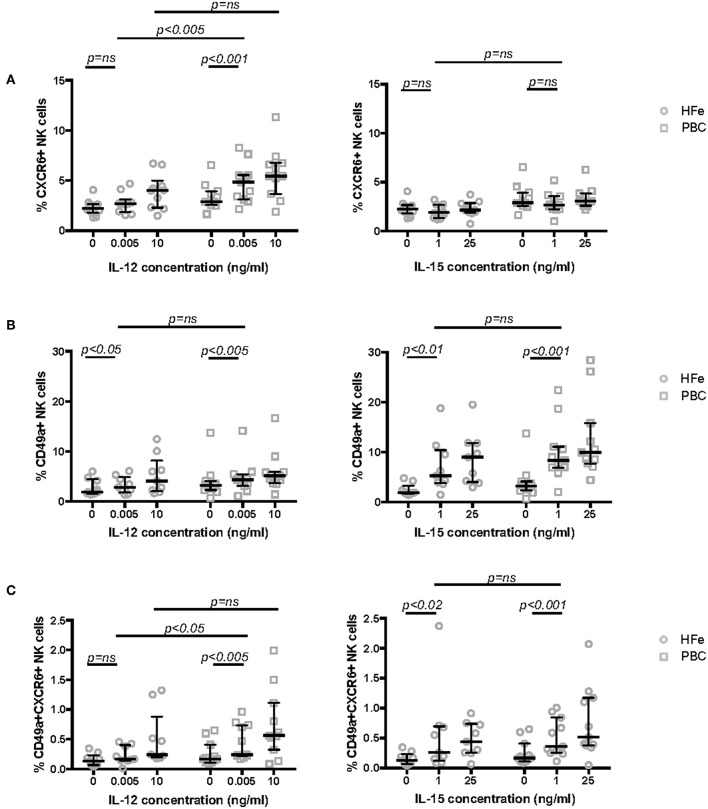
Figure 3.
(A) The frequency of CXCR6+ NK cells within the peripheral blood NK cell population of non-cirrhotic individuals with HFe (n = 10) and PBC (n = 11) following stimulation of purified NK cells for 12 h in media only and with increasing concentrations of IL-12 and IL-15. (B) The frequency of CD49a+ NK cells within the peripheral blood NK cell population of non-cirrhotic individuals with HFe (n = 9) and PBC (n = 11) following stimulation of purified NK cells for 12 h in media only and with increasing concentrations of IL-12 and IL-15. (C) The frequency of CD49a+CXCR6+ NK cells within the peripheral blood NK cell population of non-cirrhotic individuals with HFe (n = 9) and PBC (n = 11) following stimulation of purified NK cells for 12 h in media only and with increasing concentrations of IL-12 and IL-15. Dot plots show individual values, the median and interquartile range. The Mann Whitney U-test compares patient groups and the Wilcoxon matched pairs test compares conditions within the same patient group.

