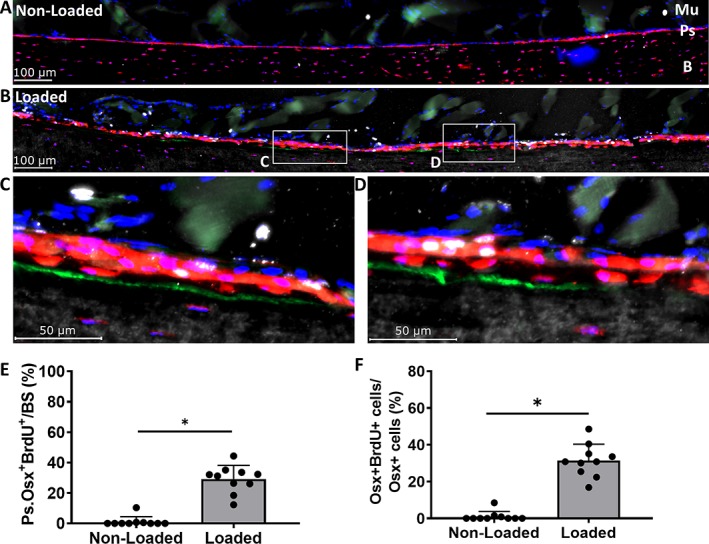
Figure 6.

(A, B) Representative 5‐bromo‐2′‐deoxyuridine (BrdU) images of the region of interest from nonloaded and loaded tibias in 12‐month‐old mice. (C, D) 40× magnifications from loaded tibias. (E) Total Ps.Osx+ (periosteum osterix positive) BrdU + surface increase with loading. (F) Ps.Osx+ BrdU + cells increase with loading. Data shown as mean ± SD (n = 10; males = 6, females = 4). * Signifies p < .05 by Student's t test. tdTomato = red; calcein = green; BrdU = white; 4,6‐diamidino‐2‐phenylindole (DAPI) = blue; Mu = muscle; Ps = periosteum; B = bone.
