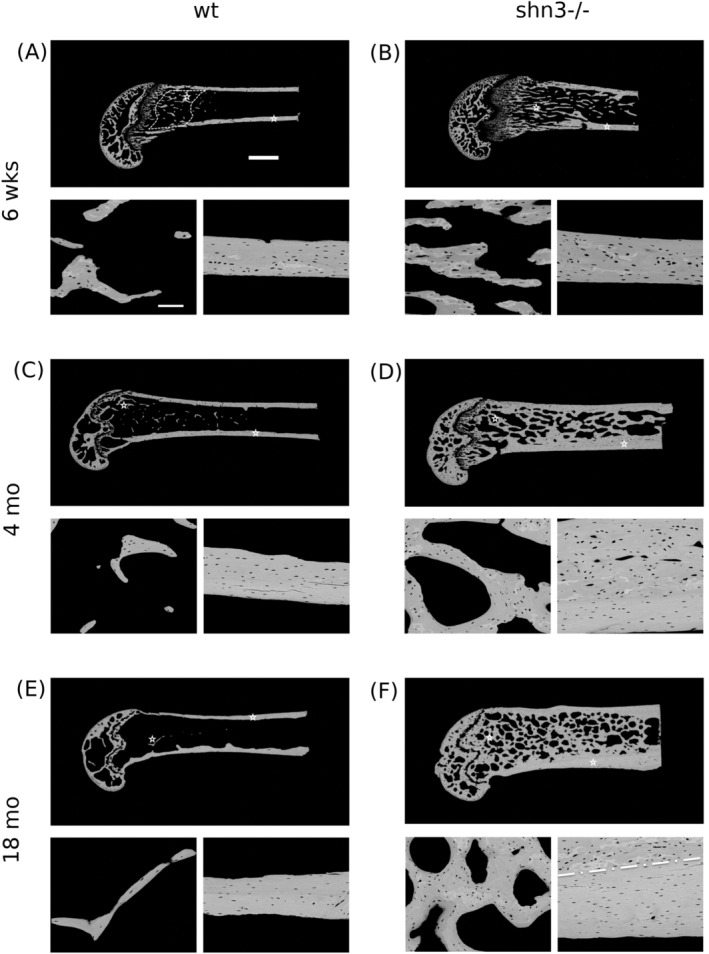
Figure 1.

Backscatter electron (BE) overview images of typical examples of longitudinal sections of distal femora from 6‐week‐old (A, B), 4 month old (C, D), and 18‐month‐old (E, F) WT and Shn3 null mice (WT in A, C, E; Shn3–/– in B, D, F). Generally, the images show the tremendous increase in cancellous and cortical bone volume with age in the Shn3‐deficient mice. The region indicated by the dashed line in the overview image in Fig. 1 A indicates the region of interest for the analysis of the microstructure of the mineralized bone, and the bar represents 1 mm. Detail images of cancellous and cortical bone obtained at higher magnification are also shown (the asterisks in the overview images show the area of the detail images). The bar in the detail image indicates 100 μm. In the detail image of the Shn3–/– mouse aged 18 months (F), the dashed white line indicates the boundary of the remnant area of primary cortical bone (top) from the lamellar cortical bone (bottom). Such two distinct areas can be seen in cortical bone detail images for all Shn3–/– and for the youngest WT. Osteocyte lacunae section morphology is clearly different in primary compared with lamellar cortical bone.
