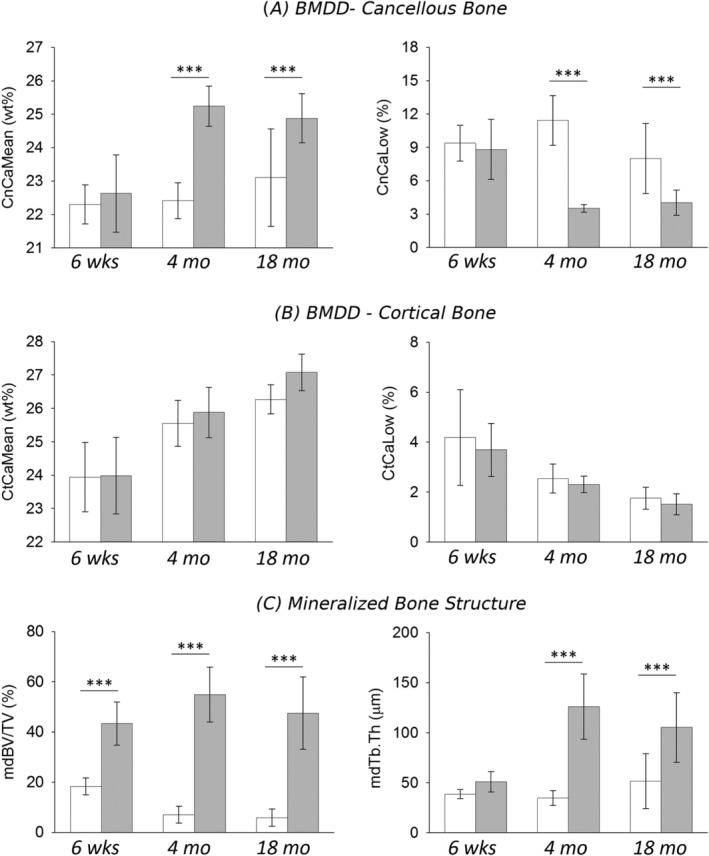
Figure 3.

Average degree of mineralization density (CaMean) and the percentage of low mineralized bone areas (CaLow) in (A) cancellous and (B) cortical bone of the distal femur. (C) Microstructure of mineralized bone (mdBV/TV = mineralized bone volume per tissue volume and mdTb.Th = mineralized trabecular thickness) for WT and Shn3–/– mice at different ages. Data are mean (SD), WT in white, and Shn3–/– in gray. n = 8 animals per genotype at age 6 weeks, n = 6 at 4 months and n = 8 at 18 months. p < .001 based on Tukey post hoc test following two‐way ANOVA. Only significant differences between Shn3–/– and WT of same age are shown. For all significant differences see Table 2.
