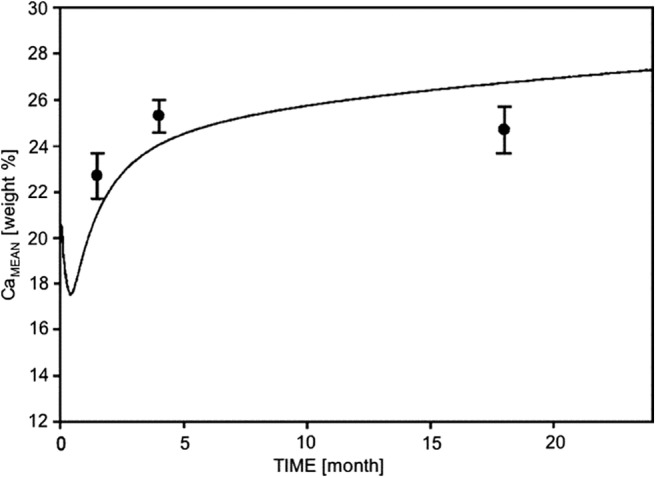
Figure 4.

Simulation of time evolution of CaMean (weighted mean calcium concentration), when the trabecular bone volume is increasing with animal age as observed in the Shn3–/– mice. Line: prediction from the computer model; black solid circles: experimental data points. Error bar ±SD.
