Figure 2.

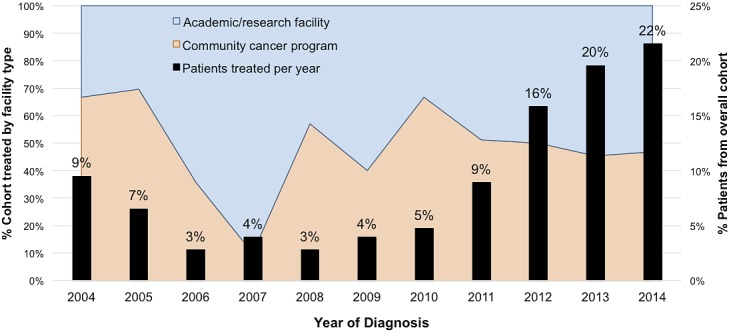
Trends in proton therapy use over time, stratified by facility type. The percentage of patients treated per year is shown as black bars, while the cumulative proportion of patients treated by facility type is reflected in blue and orange.

Trends in proton therapy use over time, stratified by facility type. The percentage of patients treated per year is shown as black bars, while the cumulative proportion of patients treated by facility type is reflected in blue and orange.