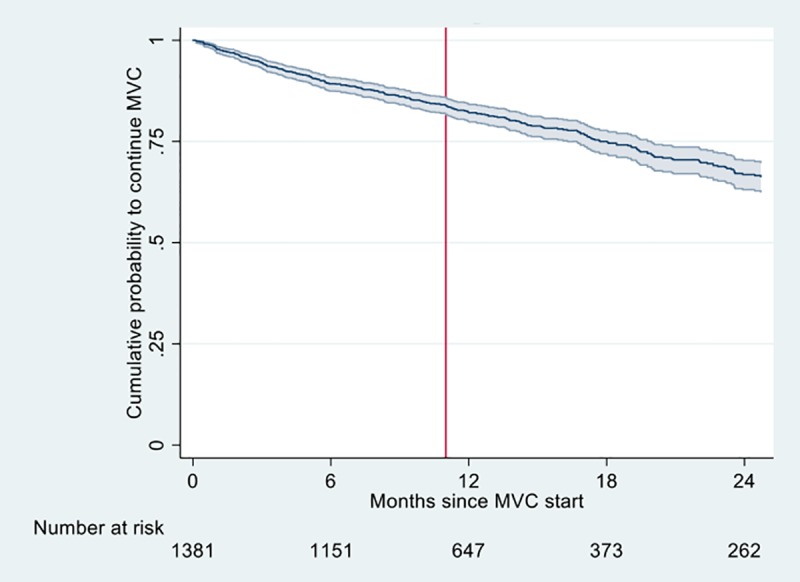
Fig 1. Kaplan-Meier curve of the cumulative probability of continuing maraviroc after its initiation in the study cohort.

The line indicates the estimate, shadows represent the 95% confidence intervals. MVC, maraviroc. The number of patients receiving maraviroc are indicated as “Number at risk”. The vertical line shows the 48 weeks cut-off point; all available data up to 24 months of follow-up were used.
