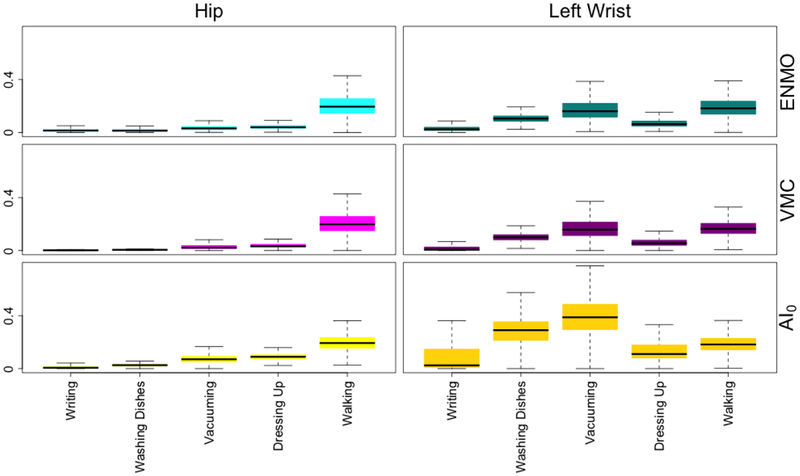
Figure 4.
Boxplots of ENMO, (top panels) VMC (middle panels) and AI0 (bottom panels) statistics derived for τ = 5-s length intervals of data collected from the hip (left column) and left wrist (right column) during writing, washing dishes, vacuuming, getting dressed and walking (x-axis), for all 49 individuals.

