
Figure 2.
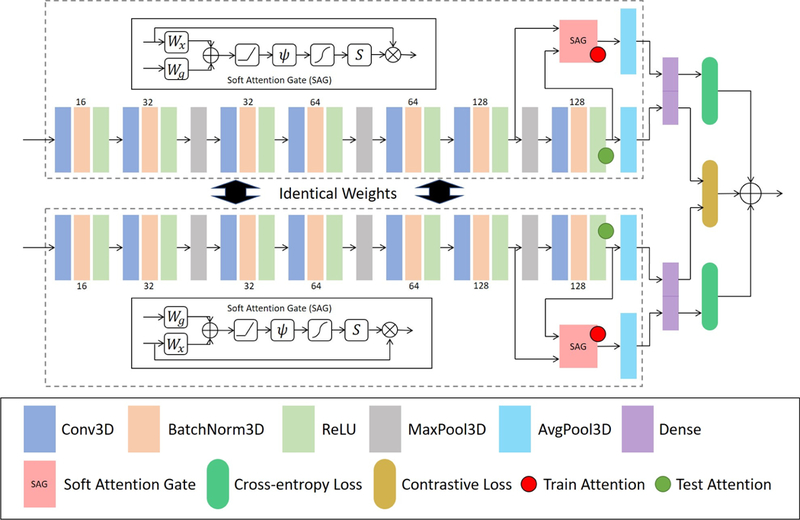
The network structure of proposed AID-Net. The inputs of the network are the longitudinal scan and rescan data, where each data consists of two channels: preprocessed CT and HU>130 mask. The outputs of the network are the classification results and training and testing attention maps. The definition on symbols of SAG subnetwork is the same as [1].