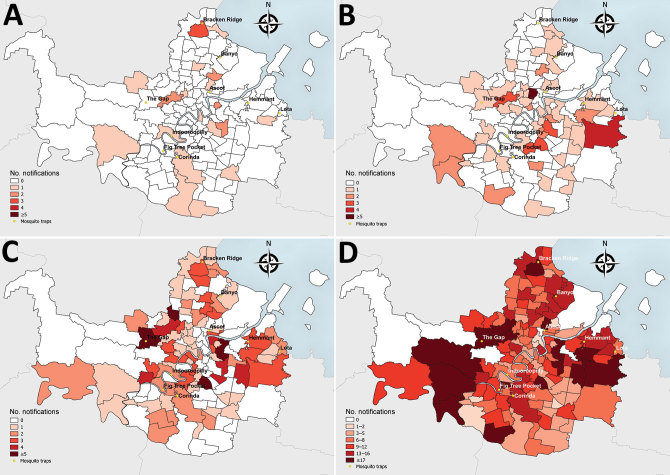
Figure 1.
Spatial distribution of Ross River virus notifications by patient residential address and Australian Statistical Geography Standard statistical area level 2 (22) and mosquito trap sites, Brisbane local government area, Queensland, Australia, 2015. A) Week 2 (first week with an increased number of cases); B) week 6 (early in outbreak); C) week 9 (peak of notified cases); and D) weeks 2–20 combined (entire outbreak period).

