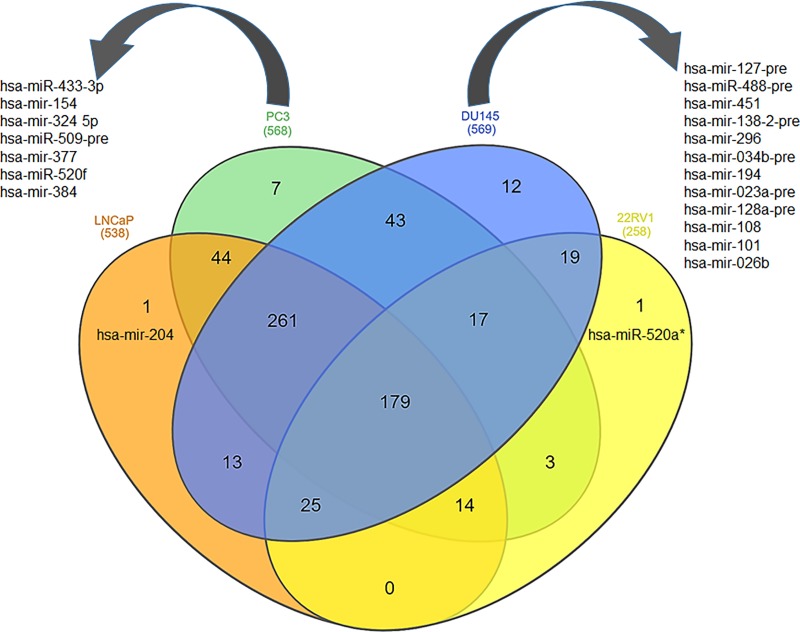
Fig 2. Prostate cancer disease-specific signature miRNAs.
Venn diagram of the overlapping and unique genes among four prostate cancer cell lines. All four cell lines were represented in orange (LNCaP cells), green (PC3), blue (DU145) and yellow (22Rv1) color and analyzed using p value cut-off < 0.001.

