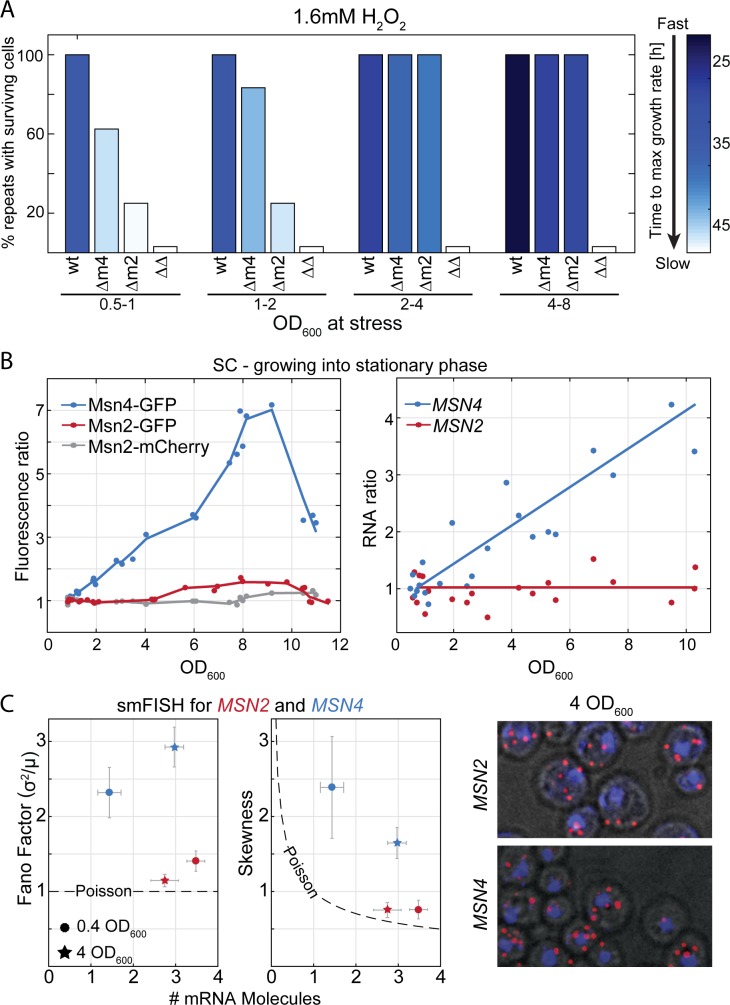
Fig 2. Msn4 expression and its contribution to stress preparation increases as cells exit exponential growth.
(A) The contribution of Msn2 and Msn4 to stress preparation changes along the growth curve: cells at different stages along the growth curve (see S6 Fig for growth curve in rich media) were diluted into media containing 1.6 mM H2O2 and were followed by continuous OD measurements to define the time at which growth was first detected. Shown is the percent of repeats with surviving cells of each strain in different cell densities and the time to resume growth (color-coded). (B) Msn4 expression increases along the growth curve in protein and transcript levels, while Msn2 expression remains stable: samples were taken from cells growing along the growth curve. Expression was measured using fluorescent protein fusion (B, left) and transcription profiles (B, right). Shown is the ratio between each measurement to the low OD measurement. (C) MSN4 expression is noisy, while MSN2 expression follows the Poissonian variance: mRNA molecules of MSN2,4 were counted in >4,000 single cells with smFISH in exponentially growing cells (circles) and at OD600 = 4 (stars). Shown are the mean number of molecules at the x-axis and the Fano factor (left) and skewness (middle) of the mRNA distribution at the y-axis. Dashed line represents the Poisson distribution parameters. (Right) smFISH imaging examples. The raw data for (A) are available in S3 Data, for (B) in S4 Data, and for (C) in S1 Data. GFP, green fluorescent protein; OD, Optical Density; SC, synthetic complete; smFISH, single-molecule Fluorescent In Situ Hybridization; WT, wild type.

