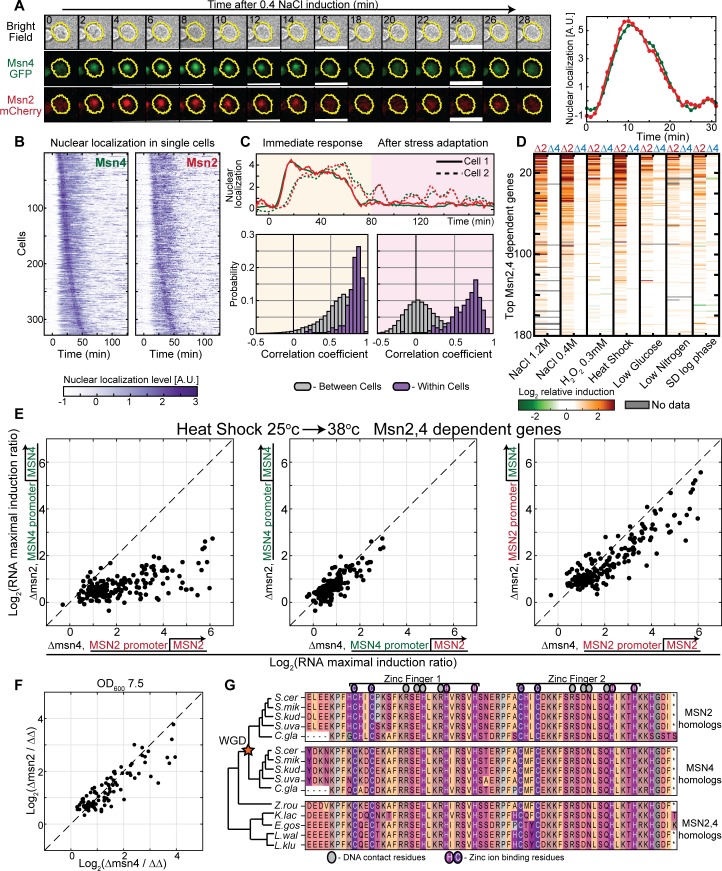
Fig 3. Redundancy in Msn2 and Msn4 activity.
(A–C) Single cells expressing Msn4-GFP and Msn2-mCherry were visualized using microfluidics-coupled live microscopy. Both proteins were readily visualized when cells were first cultured at intermediate or high OD (because Msn4 is undetectable in low ODs when cells grow exponentially). Cells were tracked as they were exposed to 0.4 M, 1.2 M, or 1.4 M NaCl. Cells were segmented, and the nuclear localization of both proteins was quantified. A representative cell in time in three channels and a quantification of nuclear localization levels of Msn2 (red) and Msn4 (green) are shown in A. Temporal traces of 328 single cells in 1.2 M NaCl, ordered in both columns by the time of Msn4-GFP nuclear localization, are shown in (B) (0.4 M and 1.4 M NaCl in S8 Fig). Correlations between the individual traces of Msn2 versus Msn4 nuclear localization levels in single cells were calculated. Distributions of the correlation coefficients within the same (purple) or in different (gray) cells are shown in C, separately comparing the immediate response (left) and the longer-time dynamics (right). (D) Stress response in rapidly growing cells depends on Msn2 but not Msn4: exponentially growing cells were exposed to the indicated stresses. Genome-wide transcription profiles were measured at 3-minute time resolution following stress induction for the first 60 minutes and 10-minute for the next 30 minutes. The stress response of each gene was summarized by its integrated (log2) change over the time course. The experiment was repeated in wild-type cells, single-deleted cells (Δmsn2, Δmsn4), and double-deleted cells (Δmsn2Δmsn4). Shown are the differences between gene induction of the wild-type versus the single-deletion strains (Δmsn2 or Δmsn4 at the left/right column, respectively). 180 genes are shown, selected and ordered by the average ratio (over all conditions) between wild-type induction and the double MSN2 and MSN4 deletion strain induction. These genes contain stress-induced modules defined by other studies (S10 Fig). (E) Msn2 and Msn4 induce the same set of target genes: during exponential growth, when Msn2 expression is higher than Msn4, deletion of Msn2 results in a significantly stronger effect on stress gene expression (left), but this effect was fully reversed by swapping the Msn2 and Msn4 promoters (middle and right). Each dot represents a target gene and its induction ratio between the indicated strain and the double MSN2 and MSN4 deletion strain. (F) Msn2 and Msn4 in high OD (7.5): when both factors are expressed, stress genes are induced equally. Each dot is an induced target gene. (G) Msn2 and Msn4 bind DNA through a highly conserved DBD: Alignment of Msn2 and Msn4 DBDs and their homologs in 10 species of the Ascomycota phylum that diverged before or after the WGD event (star). Colors indicate amino acid residue types. The raw data for (B,C) are available in S5 Data and for (D–F) are available at SRA under BioProject PRJNA541833. A.U., arbitrary unit; DBD, DNA-Binding Domain; GFP, green fluorescent protein; OD, Optical Density; SRA, Sequence Read Archive; WGD, Whole Genome Duplication.

