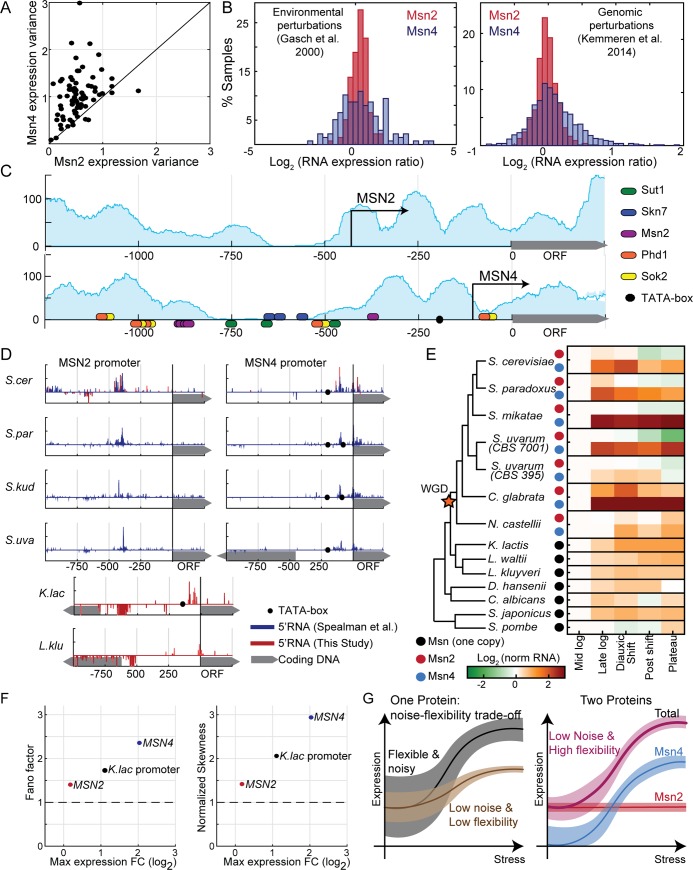
Fig 4. MSN2 shifted its TSS and gained a stable expression pattern in species that diverged from Saccharomyces cerevisiae following WGD.
(A–B) Three data types were considered. First, we downloaded >230 mRNA expression data sets available in SPELL [44] and compared the variance of MSN2 and MSN4 expression in each data set with more than 20 samples (A, each data set is a dot). Second, we compared the distribution of MSN2 and MSN4 expression levels in two large data sets, representing multiple stress conditions [13] (B, left) or gene deletions [45] (B, right). (C) The MSN2 promoter displays properties of the stable, low-noise type, while MSN4 promoter conforms to the flexible noisy type: the pattern of nucleosome occupancy along the two promoters as defined by Weiner and colleagues [46] is shown in blue shade. Arrows represent TSS positions, as defined by Park and colleagues [47]. Ellipses denote TF binding sites as defined by MacIsaac and colleagues [48]. TATA box (black circles) is defined as TATA[AT]A[AT]. (D) MSN2 promoter displays an uncharacteristically long 5′ UTR that is conserved in all species that diverged after the WGD event: shown are the promoter maps of MSN2,4 homologs in the indicated species. mRNA 5′ end mapping data from Spealman and colleagues [49] are shown in blue, mRNA 5′ end from this study in red. TATA box is defined as in C. (E) MSN2 homologs are stably expressed along the growth curve, while MSN4 homologs show the flexible expression of the single MSN homologs found in species that diverged from S. cerevisiae prior to the WGD event: shown are expression levels of the MSN2,4 homologs in all indicated species, in 5 time points along the growth curve. Data from Thompson and colleagues [50]. (F) Expression of the Kluyveromyces lactis MSN2,4 homolog shows intermediate flexibility and noise. On the x-axis, the maximal fold change expression of MSN2, MSN4, and the K. lactis homolog (data from Thompson and colleagues [50]) is shown. y-Axes show attributes of the expression distribution measured by smFISH, in MSN2, MSN4, and MSN2 in S. cerevisiae driven by the promoter of the K. lactis homolog. Shown are the Fano factor (left) and the skewness of the distribution normalized to the skewness of a Poisson distribution with the same mean as the data (right). (G) Model: duplication of Msn2,4 resolved conflict between environmental responsiveness and noise: single genes whose expression is sensitive to environmental conditions but will suffer from high noise in nonstressed conditions, limiting the ability to precisely tune intermediate expression levels while maintaining environmental-responsive expression. Gene duplication can resolve this conflict. See text for details. The raw data for (F) are available in S1 Data. smFISH, single-molecule Fluorescent In Situ Hybridization; SPELL, Serial Pattern of Expression Levels Locator; TF, transcription factor; TSS, Transcription Start Site; WGD, Whole Genome Duplication.

