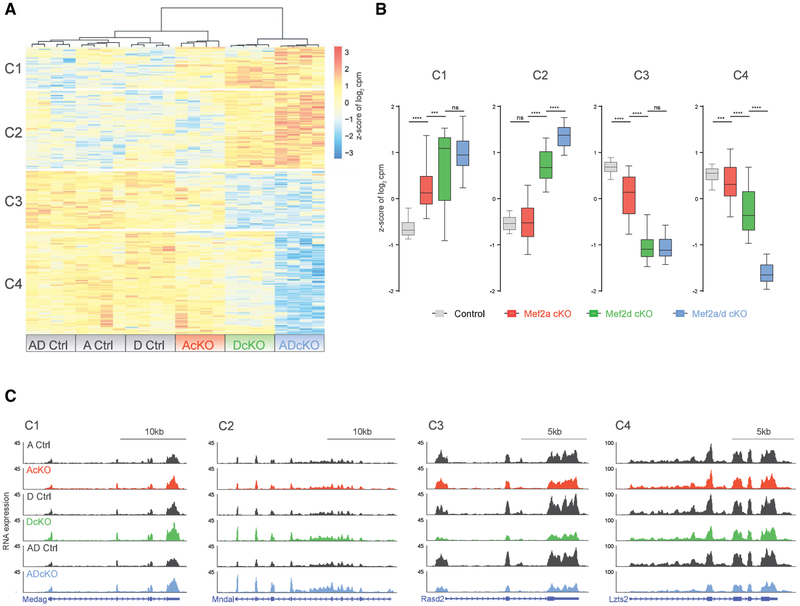
Figure 2. MEF2A and MEF2D Exhibit Complex Patterns of Gene Regulation in Cerebellum.
(A) Hierarchical clustering of gene expression of AcKO, DcKO, ADcKO, and respective control (Ctrl) P22 mouse cerebellum for genes detected as significantly dysregulated (false discovery rate [FDR], <0.05) in analysis of RNA-seq from Ctrl and ADcKO cerebellum (n = 4 biological replicates per genotype). Four clusters are indicated on the left side of the heatmap. Heat represents Z score of log2 cpm (counts per million) for a given gene.
(B) Box-whisker plots representing median and distribution of the Z score of log2 cpm for control, AcKO, DcKO, and ADcKO mice show distinct trends in gene expression for each of the four clusters (C1–C4) of genes identified in (A). ****p < 10−4, ***p < 10−3, one-way ANOVA, Tukey’s multiple comparison test; n.s., not significant.
(C) WashU Epigenome browser view of RNA-seq coverage from AcKO, DcKO, ADcKO, and respective control (Ctrl) mice, illustrating changes in gene expression for each of the four clusters (C1–C4).
See also Figure S2.

