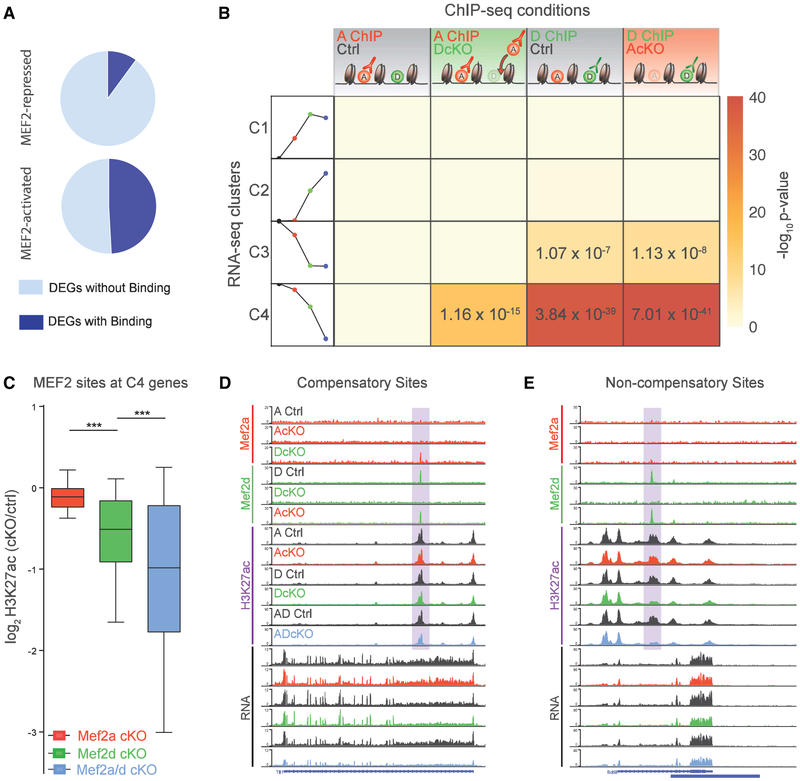
Figure 4. Compensatory Binding by MEF2A at a Subset of MEF2-Activated Target Genes Confers Robustness to MEF2D Depletion on Gene Expression.
(A) Pie chart representing proportion of MEF2-repressed (top) and MEF2-activated (bottom) genes associated with MEF2A and/or MEF2D genomic binding sites.
(B) Table represents significance of overlap of RNA-seq clusters with MEF2A and MEF2D peaks identified in various ChIP-seq conditions. Columns from left to right: MEF2A ChIP in control mice; MEF2A ChIP in DcKO mice (compensatory sites); MEF2D ChIP in control mice; and MEF2D ChIP in AcKO mice. Rows from top to bottom represent RNA-seq clusters 1, 2, 3, and 4 (C1, C2, C3, and C4), as depicted by a schematic of the trends in gene expression (schematization of Figure 2B): control (black circle), AcKO (red circle), DcKO (green circle), and ADcKO (blue circle) mice. Heat represents −log-10 p value significance of overlap determined by hypergeometric test, with significant values displayed.
(C) For compensatory direct target genes (defined as genes from compensatory C4 associated with MEF2-bound sites): box-whisker plots show median and distribution of log2-transformed fold change of H3K27ac in different conditional knockout mice over respective control mice. ***p < 10−3, ANOVA followed by Tukey’s multiple comparison test.
(D) WashU Epigenome Browser view of an intragenic enhancer site (highlighted) of a compensatory direct target gene, showing MEF2A, MEF2D, and H3K27ac ChIP-seq and RNA-seq coverage from AcKO, DcKO, AdcKO, and respective control (Ctrl) mice.
(E) Same format as (D) for intragenic enhancer site (highlighted) at non-compensatory direct target gene.
See also Figure S4.

