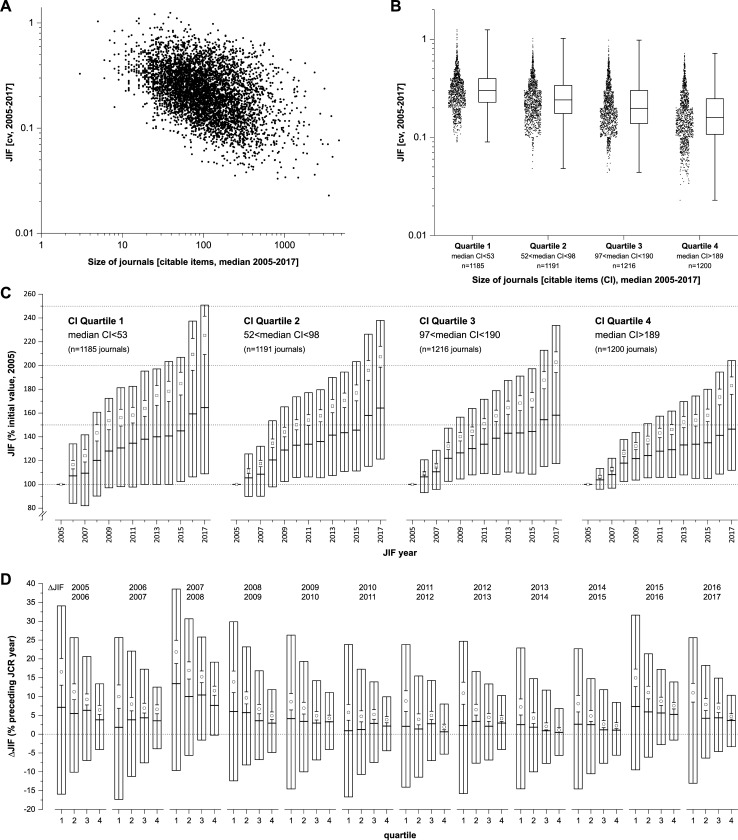
Fig 2. Association between JIF variability (coefficient of variation) and the size of journals (CI).
(A) Double-logarithmic scatter plot for the JIF’s cv and size of journals (CI, citable items). (B) Box plots showing the 25th and 75th percentiles, median (horizontal line) and range (whiskers) for the four quartiles of journal size (q1-q4). (C) Longitudinal trend of the JIF related to the initial value (2005 JCR) for each journal. The box plots show the 25th and 75th percentiles, median (horizontal line), mean (open square) and 95% confidence interval (whiskers). (D) The relative changes in JIF (% preceding year) are shown for q1-q4 (box plots were designed as in (C)). In all graphs, journals with complete data sets for JCR and CI for the JCR years 2005–2017 are included (n = 4792).

