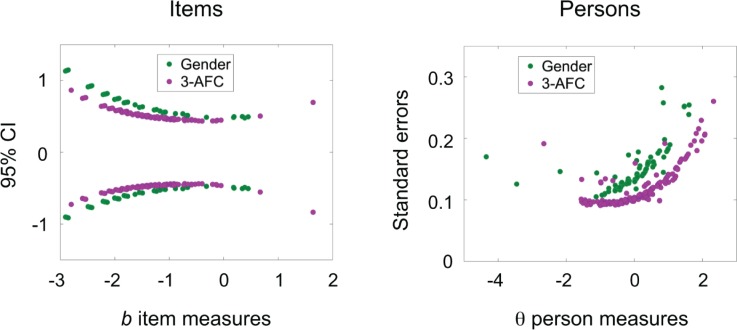
Fig 2. Confidence intervals for estimated item and person measures.
Estimated item measures are plotted with their 95% CI (left), and estimated person measures are plotted with their standard errors (right), in d′ units. The data are color coded by 2-AFC (green) and 3-AFC (purple) and show that confidence intervals depend on the number of response alternatives.

