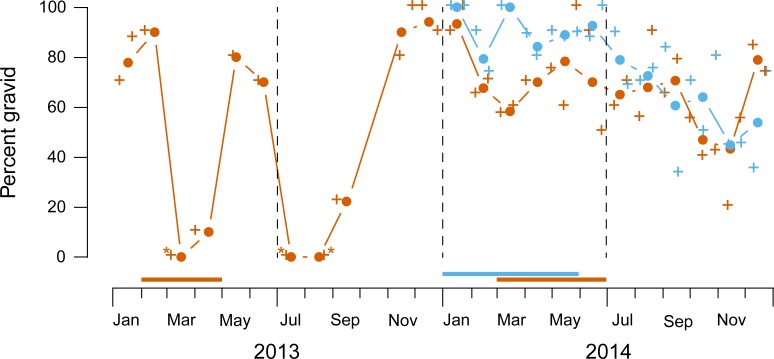
Fig 3. Frequencies of gravid (vs. undeveloped) Philornis females.
Data from 2013–2014 at the lowland site are shown in orange, and data from 2014 at the highland site are shown in blue. Crosses are raw proportions of n = 7–19 females (or * n = 2). Filled circles with lines are pooled proportions plotted at midmonth, estimated with binomial regression. Horizontal bars above calendar scales represent breeding seasons of known hosts.

