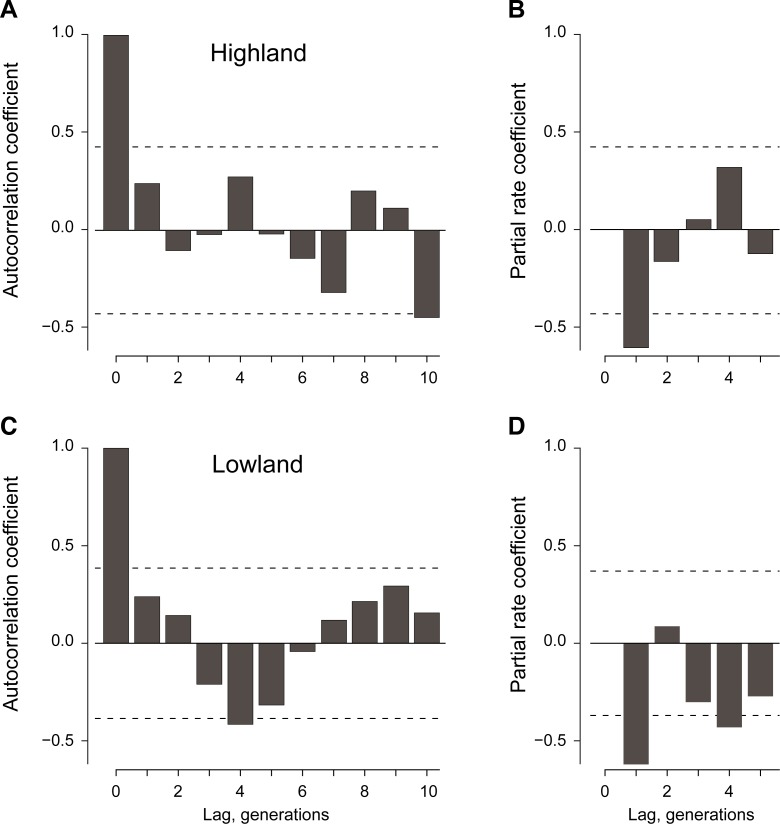
Fig 5.
Temporal autocorrelation coefficients (A, C) and partial rate correlation coefficients (B, D) among consecutive generations of female P. downsi at the highland and lowland study sites. Coefficients outside the dashed horizontal bands in each panel are significantly different from zero (α = 0.05).

