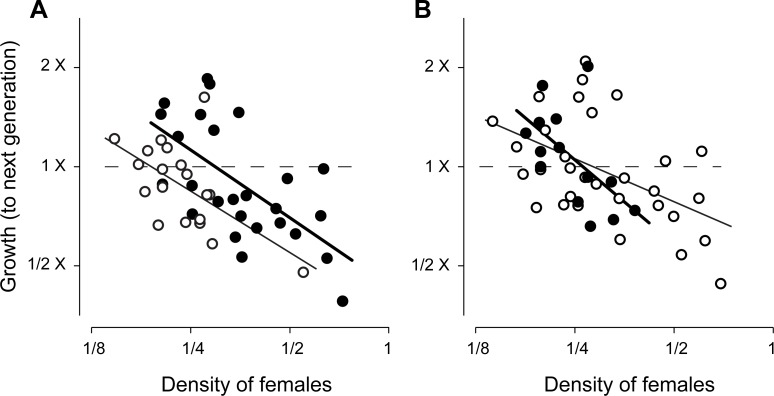
Fig 6. Inverse relations between growth rates and densities of female P. downsi, expressed as Log2-transformed daily catch rates.
A: Growth at lowland site (filled circles) versus highland site (open circles), seasons combined; B: growth during bird breeding season (filled circles) versus non-breeding season (open circles), locations combined. Solid lines are least-squares regression lines fit to data in each subgroup separately. Horizontal dashed lines indicate population replacement, and intersections with regression lines indicate estimated carrying capacities, which were greater at the lowland site, but independent of bird breeding season.

