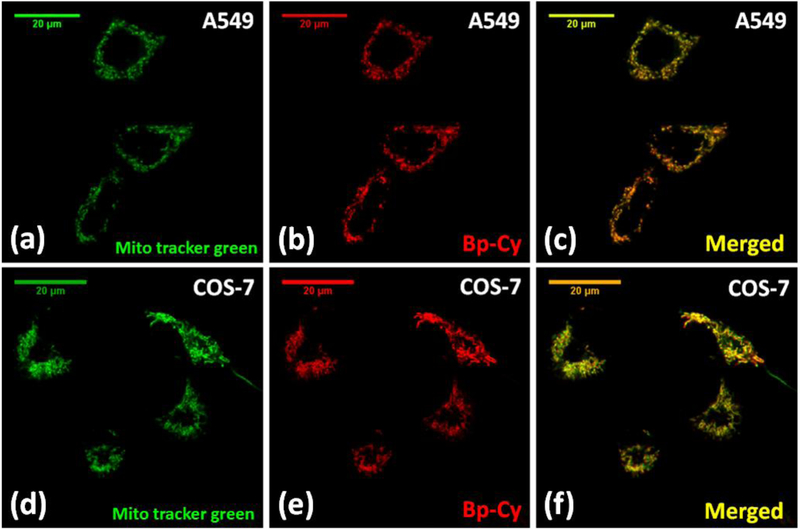
Figure 4.
Fluorescent confocal microscopy images of A549 and COS-7 cells (×63 oil) treated with MitoTracker Green-FM (200 nM) and probe 2 (500 nM) for 30 minutes. Figures (a) – (c) represents the colocalization studies in A 549 cells and figures (d) – (f) represents colocalization studies in COS-7 cells. MitoTracker Green was excited with 488 nm lase and emission was collected from 500 nm – 580 nm range. 454 nm laser was used for probe 2 excitation and emission was collected from 610 nm to 720 nm (SYPRO Ruby configuration).

