
Fig. 2.
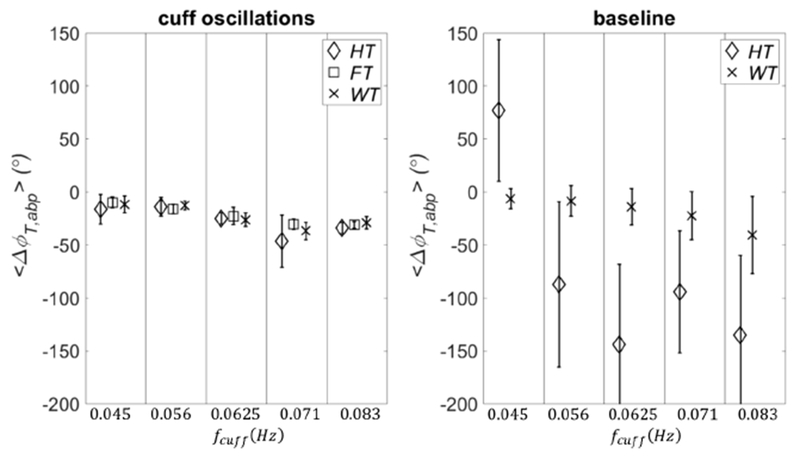
Phase difference between T and abp at the cuff frequencies. On the left panel the phase differences were calculated as averages across the main lobe of the cuff frequencies with the analytic signal (HT), wavelet cross spectrum (WT), and cross power spectral density (FT) methods. For the wavelet (WT) and analytic signal (HT) methods, the averages were also carried out in the time intervals when the cuff was oscillating at each specific frequency. On the right panel the time-frequency averages of the phase differences were calculated with analytic signal and wavelet methods during baseline. The vertical lines define the different cuff frequencies. The error bars are the standard deviations across the frequencies of the main lobe of the cuff frequencies (FT) or across the temporal ranges of cuff oscillations (WT and HT).