
Fig. 3.
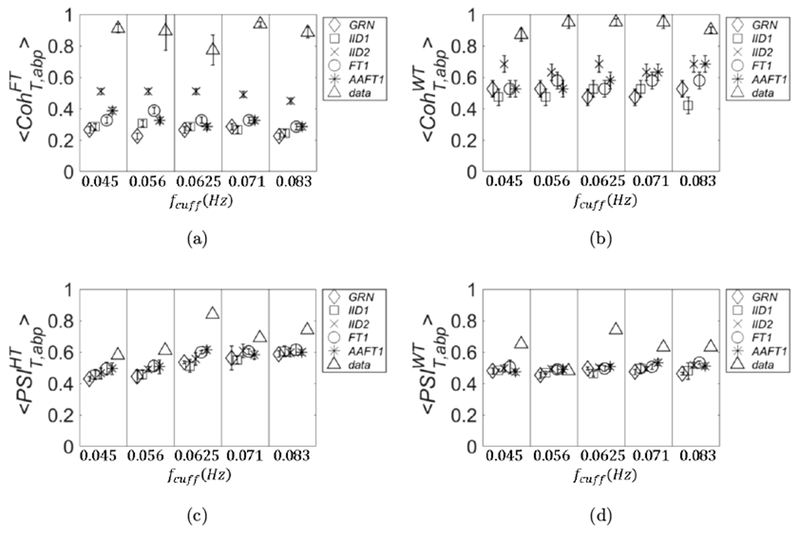
The threshold values of coherence and PSI are shown for five different methods to generate surrogate data together with the values calculated for an experimental data set in vivo (subject 1). The x axis is defined as in Fig. 2. Specifically, in the four panels are plotted: linear coherence (a), wavelet coherence (b), PSI calculated with analytic signal (c), and PSI calculated with wavelet cross spectrum (d). The methods for surrogate data are: GRN (diamonds), IID1 (squares), IID2 (crosses), FT1 (circles), and AAFT1 (asterisks). The experimental data are represented by triangles.