
Fig. 9.
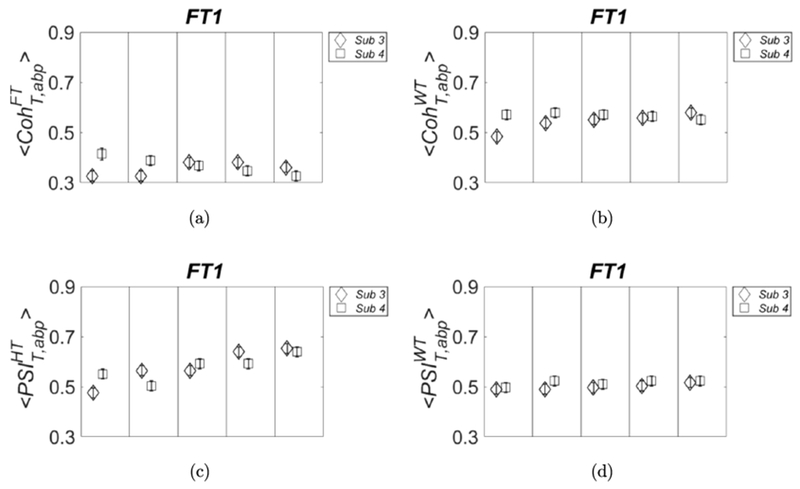
Threshold values obtained with surrogate data FT1 for: (panel (a)), (panel (b)), (panel (c)) and (panel (d)). We used higher statistics as in Fig. 8.
Official websites use .gov
A
.gov website belongs to an official
government organization in the United States.
Secure .gov websites use HTTPS
A lock (
) or https:// means you've safely
connected to the .gov website. Share sensitive
information only on official, secure websites.
Threshold values obtained with surrogate data FT1 for: (panel (a)), (panel (b)), (panel (c)) and (panel (d)). We used higher statistics as in Fig. 8.