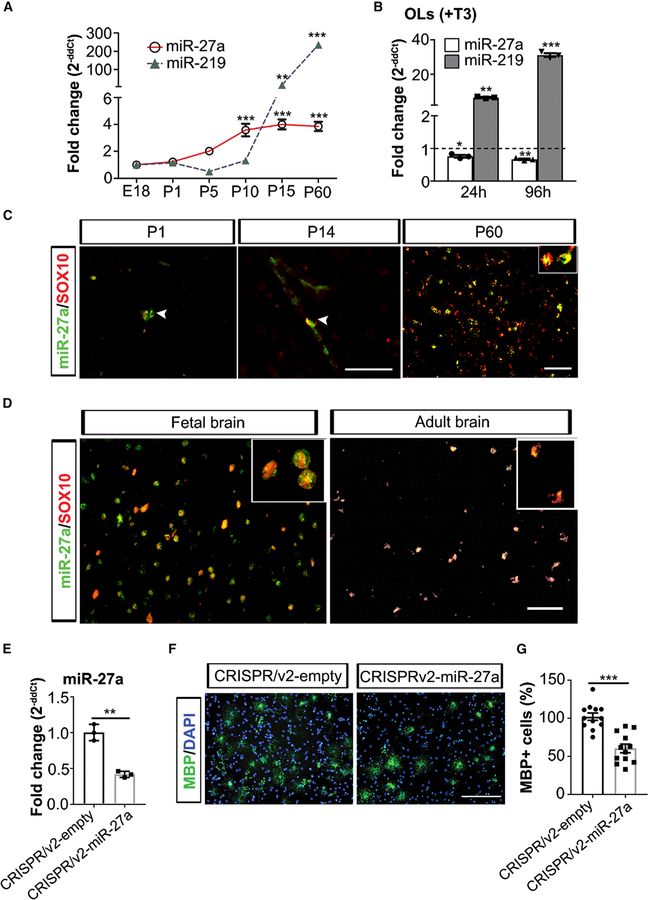
Figure 1. miR-27a Is Expressed during All Stages of OL Generation.
(A) qPCR analyses of miR-27a and miR-219 levels in mouse whole brain at different ages during brain development. miR-361 was used as an internal control for qPCR analyses. Data represent mean ± SEM fold change of three different mouse brain tissues; **p < 0.01, ***p < 0.001; one-way ANOVA with Dunnett’s post hoc test, multiple comparisons.
(B) qPCR analysis of endogenous miR-27a and miR-219 levels in differentiated mouse OLs (+T3) for 24 h and 96 h. miR-361 was used as an internal control for qPCR analyses. Horizontal dashed line represents respective miRNA levels in OPCs (FC = 1). Data represent mean ± SEM fold change of 3 independent experiments; *p < 0.05, **p < 0.01, ***p < 0.001; one-way ANOVA with Dunnett’s post hoc test, multiple comparisons. FC, fold change.
(C) Representative immune-in situ hybridization images (from three mouse brains) of miR-27a (green) and SOX10 (red) staining of sections from P1 (left), P14 (middle), and P60 (right). Scale bars, 40 mm (P1, P14) and 50 μm (P60).
(D) Representative immune-in situ hybridization images (from four human fetal brains and three adult brains) of miR-27a (green) and SOX10 (red) staining of human brain sections (fetal [left] and adult [right]). Scale bar, 50 μm.
(E) qPCR analysis of miR-27a levels in CRISPRv2-empty and CRISPRv2-miR-27a KO mouse EpiSC-derived OPCs. U6 small nucleolar RNA (snRNA) was used as an internal control for qPCR analysis. Data represent mean ± SEM fold change of 3 independent experiments; **p < 0.01; Student’s t test, two-sided.
(F) Representative images (from three independently repeated experiments with similar results) of CRISPRv2-empty (left) and CRISPRv2-miR-27a KO (right) mouse EpiSC-derived OPCs differentiation into OLs. Scale bar, 100 μm.
(G) Percentage of MBP+ OLs in CRISPRv2-empty and CRISPRv2-miR-27a KO mouse EpiSC-derived OPCs after differentiation. Data represent mean ± SEM of MBP+ cells from 3 independent experiments; ***p < 0.001; Student’s t test, two-sided.
See also Figure S1.

