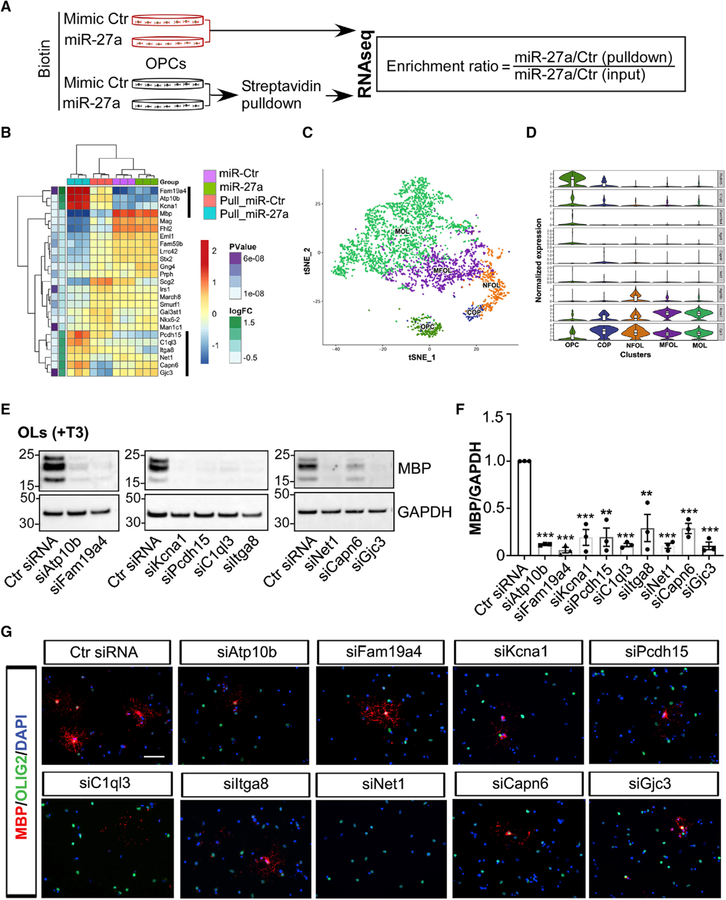
Figure 4. miR-27a Targets Unique Genes to Alter Maturation of OPCs.
(A) Schematic diagram showing miRNA transfection to mouse OPCs and biotin-tagged affinity capture of the miR-27a-mRNA complex.
(B) Heatmap showing differentially enriched transcripts in miR-27a-transfected mouse OPCs. Highlighted (black line) enriched genes were further functionally validated.
(C) t-SNE projection of cell clusters during normal OL linage development showing expression of selected differentially enriched genes.
(D) Violin plots of the top nine differentially enriched genes, potentially a direct target of miR-27a, in major OL subpopulations. Violin plots are centered on the median with interquartile ranges, and shape represents cell distribution. OPC, oligodendrocyte precursor cell; COP, differentiation-committed oligodendrocyte precursor; NFOL, newly formed oligodendrocyte; MOFL, myelin-forming oligodendrocyte; MOL, mature oligodendrocyte.
(E) Representative western blot images (from three independent experiments with similar results) of MBP expression in siRNA-transfected mouse OLs. GAPDH expression was used as a loading control.
(F) Western blot quantification analyses of MBP levels in siRNA-transfected mouse OLs. Data represent mean ± SEM of 3 independent experiments; **p < 0.01, ***p < 0.001; Student’s t test, two-sided.
(G) Representative immunofluorescence images (from three independent experiments with similar results) showing MBP+ cells (red) and Olig2+ cells (green) in siRNA-transfected mouse OLs. Nuclei were stained with DAPI (blue). Scale bar, 50 μm.
See also Figure S4.

