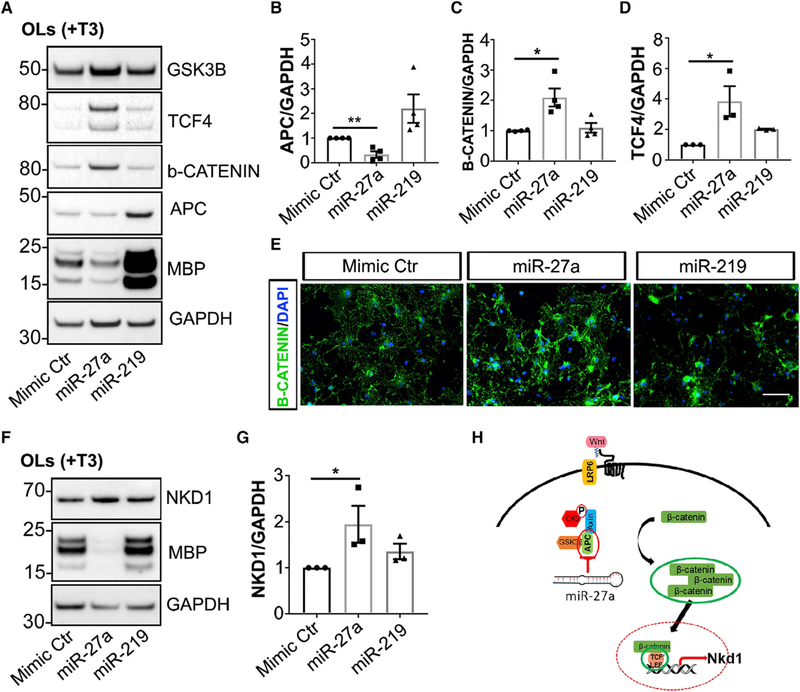
Figure 6. miR-27a Inhibits Differentiation of OPCs by Targeting APC and Modulating NKD1.
(A) Representative western blot images (from three to four independent experiments with similar results) of MBP, APC, β-CATENIN, TCF4, and GSKβb expression in miRNA mimic Ctr-, miR-27a-, and miR-219-transfected mouse OLs. GAPDH expression was used as a loading control.
(B–D) Western blot quantification analyses of APC (B), β-CATENIN (C), and TCF4 (D) levels in miRNA mimic-transfected mouse OLs. Data represent mean ± SEM of 3–4 independent experiments; *p < 0.05, **p < 0.01; Student’s t test, two-sided.
(E) Representative immunofluorescence images (from three independent experiments with similar results) showing β-CATENIN+ cells (green) in miRNA mimic Ctr-transfected (left), miR-27a-transfected (middle), and miR-219-transfected (right) mouse OLs in differentiation media. Nuclei were stained with DAPI (blue). Scale bar, 50μm.
(F) Representative western blot images (from three independent experiments with similar results) of MBP and NKD1 expression in miRNA mimic Ctr-, miR-27a-, and miR-219-transfected mouse OLs. GAPDH expression was used as a loading control.
(G) Western blot quantification analyses of NKD1 levels in miRNA mimic-transfected mouse OLs. Data represent mean ± SEM of 3 independent experiments; *p < 0.05; Student’s t test, two-sided.
(H) Schematic diagram showing miR-27a activation of Wnt/β-catenin signaling via regulating Apc expression, thus leading to β-catenin-Tcf4-Nkd1 axis activation in OLs.

