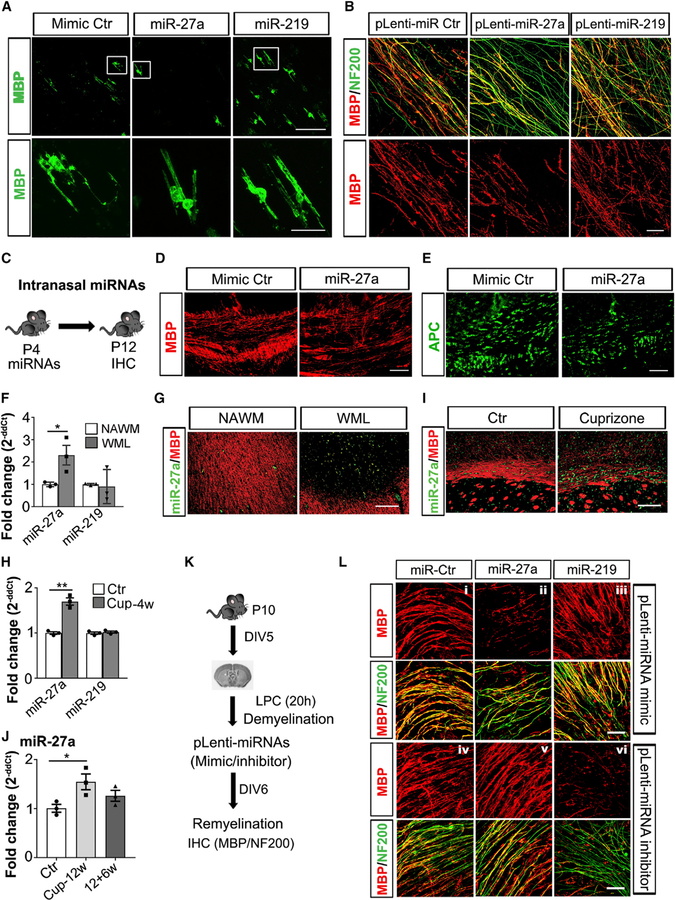
Figure 7. In Vivo Administration of miR-27a Inhibits Developmental Myelination and Remyelination.
(A) Representative confocal images (from three independently repeated experiments with similar results) of MBP (green) staining of miRNA mimic Ctr-transfected (left), miR-27a-transfected (middle), and miR-219-transfected (right) mouse OLs showing myelination of artificial microfibers. Scale bar, 50 mm. A higher magnification of the framed region is shown below respective samples. Scale bar, 20 μm.
(B) Representative confocal images (from three independent experiments with similar results) of myelinated axons (MBP [red], NF200 [green]) in P4 mouse brain sections transduced to miRNA mimic-expressing lentivirus (Ctr [left], miR-27a [middle], and miR-219 [right]).
(C) Schematic diagram showing the paradigm of intranasal miRNA administration at P4 and brain sample collection for immunohistochemistry (IHC) at P12.
(D and E) Representative immunohistochemical images (from three mouse brains) of myelin (D, MBP [red]) and mature OLs (E, APC [green]) in miRNA mimic Ctr- and miR-27a-treated P12 mouse brain corpus callosum. Scale bar, 50 μm.
(F) qPCR analysis of miR-27a and miR-219 levels from three MS brain tissues. U6 snRNA was used as an internal control for qPCR analysis. Data represent mean ± SEM fold change from 3 independent MS brains; *p < 0.05; Student’s t test, two-sided. WML, white-matter lesion; NAWM, normal-appearing white matter.
(G) Representative immune-in situ hybridization images (from three different MS brain lesions) of miR-27a (green) and MBP (red) staining in NAWM (left) and WML (right). Scale bar, 100 μm.
(H) qPCR analysis of miR-27a and miR-219 levels in mouse brain corpus callosum fed a cuprizone diet for 4 weeks (Cup-4w). U6 snRNA was used as an internal control for qPCR analysis. Data represent mean ± SEM fold change from 3 different mouse brains; **p < 0.01; Student’s t test, two-sided.
(I) Representative immune-in situ hybridization images (from three different mouse brains with similar results) of miR-27a (green) and MBP (red) staining in corpus callosum of mouse brain, Ctr (left) and Cup (right). Scale bar, 50 μm.
(J) qPCR analysis of miR-27a levels in mouse brain corpus callosum during demyelination (Cuprizone, 12 weeks, Cup-12w) and remyelination (12+6w). U6 snRNA was used as an internal control for qPCR analysis. Data represent mean ± SEM fold change from 3 different mouse brains; *p < 0.05; Student’s t test, two-sided.
(K) Schematic diagram showing the paradigm of mouse brain organotypic sectioning at P10, induction of LPC-mediated demyelination, miRNA-expressing lentivirus transduction (mimic and inhibitor), remyelination, and IHC analysis.
(L) Representative confocal images (from three independent experiments with similar results) of myelinated axons in LPC+ and miRNA mimic-expressing (i–iii) and inhibitor-expressing (iv–vi) lentivirus (pLenti-miRNA Ctr [left panel, i and iv]; pLenti-miR-27a [middle panel, ii and v]; and pLenti-miR-219 [right panel, iii and vi]) transduced mouse brain organotypic sections, respectively. Myelin is shown in red (MBP), and axons are shown in green (NF200) pseudocolor. Scale bar, 20 μm.
See also Figure S6.

