Fig. 2.
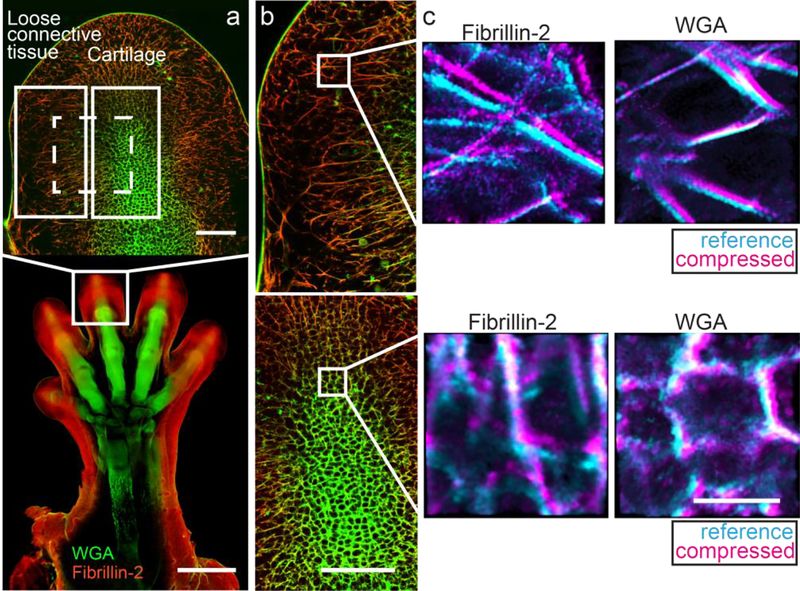
Representative confocal images of a decellularized murine forelimb. a. Global confocal image of the developing forelimb stained with wheat germ agglutinin (WGA; green) and for fibrillin-2 (red) at 10× (bottom; scale bar=500 μm) and at 25×, focusing on the distal phalange (top; scale bar=100 μm). The location of the cartilage and the adjacent loose connective tissue are boxed and labeled in white. Dashed box (white) represents the area analyzed when quantifying regional differences, including both cartilage and the adjacent loose connective tissue in the same sub-stack. b. Composite images of the loose connective tissue (top) and the cartilage (bottom), indicating the spatial distribution of fibrillin-2 (red) and WGA (green) (scale bar=100 μm). c. Composite images of a representative sub-stack in the loose connective tissue (top) and the cartilage (bottom) corresponding to fibrillin-2 (left) and WGA (right), showing an overlay of the reference (cyan) and compressed (magenta) (scale bar=10 μm).

