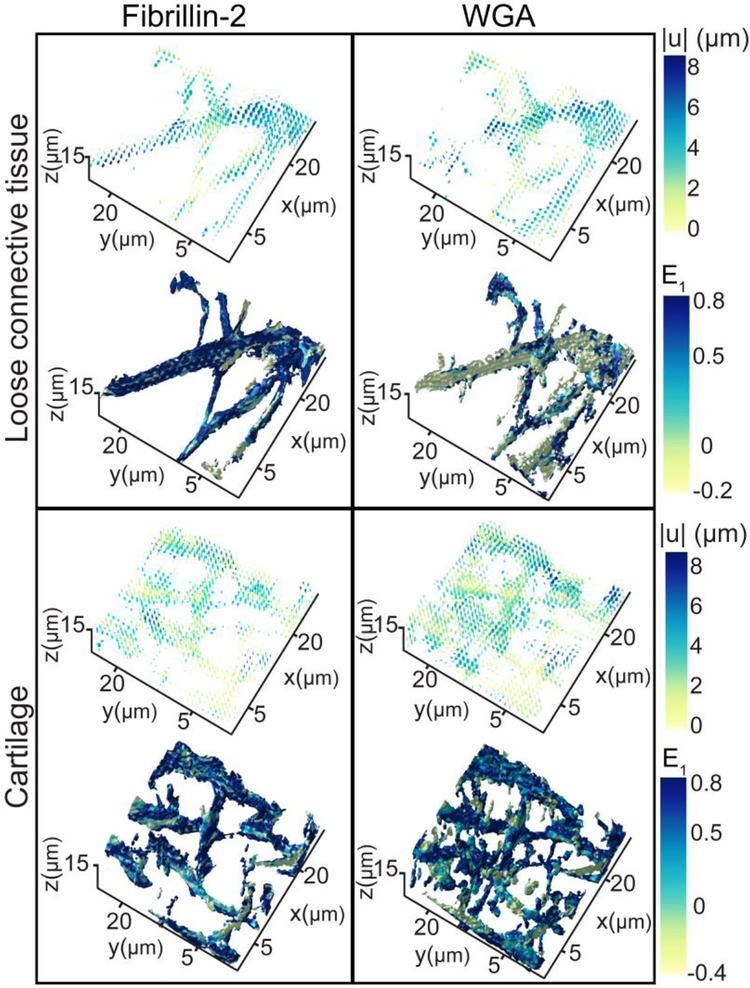
Fig. 3.
Representative deformation response from sample B for WGA and fibrillin-2 sub-stacks of 22×22×15 μm3 in the cartilage and loose connective tissue. Displacements are represented as vector fields with color representing magnitude from 0 to 8 μm. maximum principal strain (E1) is shown on the surface of the segmented ECM networks with color representing magnitude ranging from −0.4 to 0.8.

