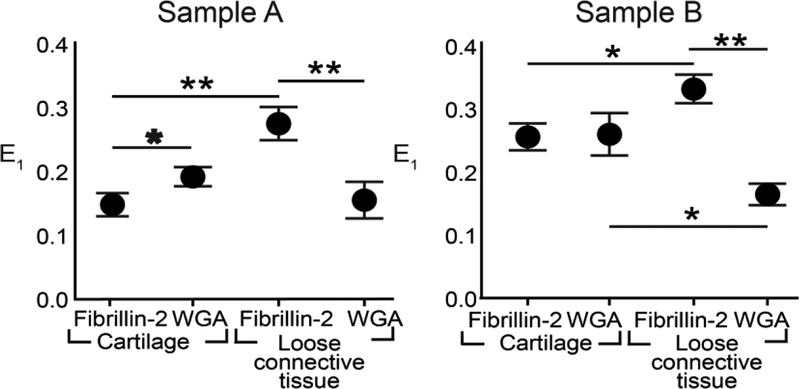
Fig. 4.
Comparison of independent samples reveals similar trends in ECM strain profiles. Maximum principal strain (E1) for sample A (left) and sample B (right) was dependent on both protein and region (p ≤0.0021; p ≤ 0.032, respectively, two-way ANOVA). Tukey post-hoc comparison showed significant differences between individual groups (*0.0021 < p ≤ 0.032; **0.0002 < p ≤ 0.0021) (n=3; bars = S.D.).

