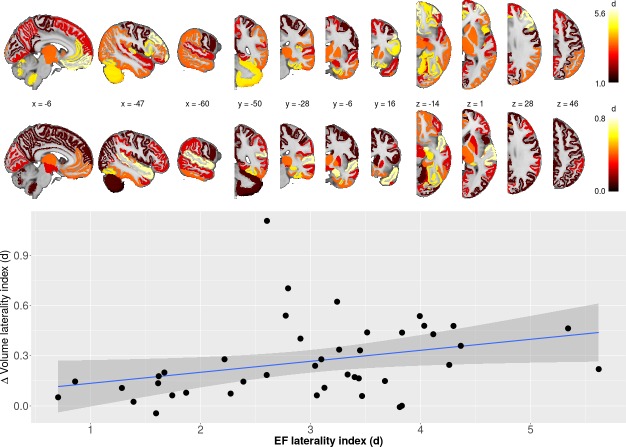
Figure 2. Laterality differences in EF and ∆vol (upper panel) as well as the relationship between laterality between EF/∆vol (lower panel).
Regression line indicates the correlation between laterality indices of EF and volume change (r = 0.32; p<0.05; df = 40; t = 2.13).

