. 2019 Oct 23;8:e49115. doi: 10.7554/eLife.49115

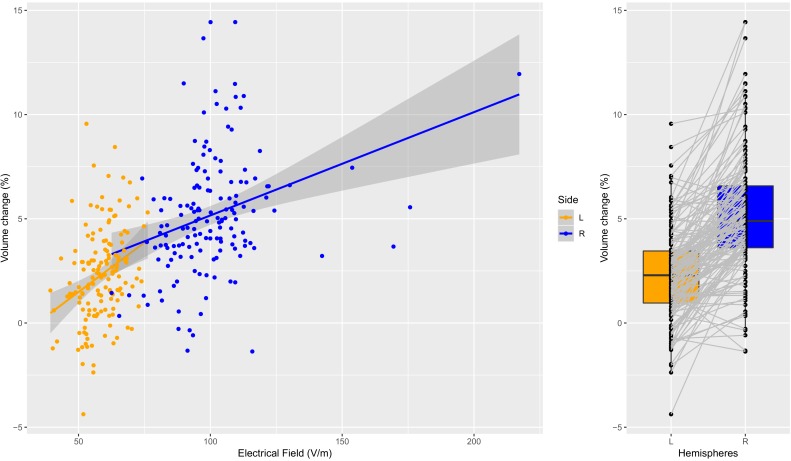
Figure 4. Individual specific relationship between EF and volume change in the amygdala.

Left: Scatterplot of EF versus volume change in the amygdala (t = 11.35, df = 300, r = 0.55, p<0.0001; left and right side together). Both the left (orange dots) and right (blue dots) hemisphere shows highly significant relationships (t = 4.01, df = 149, r = 0.31, p=0.0001; and t = 4.02, df = 149, r = 0.31, p=0.0001). Right: The difference in right and left amygdala volume changes is significant (t = 13.58, df = 150, mean difference = 0.029, p<0.0001).

Figure 4—source data 1. Left and right amygdala EF and volume change in 151 individual.

Figure 4.

Figure 4—figure supplement 1. Amygdala EF and volume change.

Figure 4—figure supplement 1.

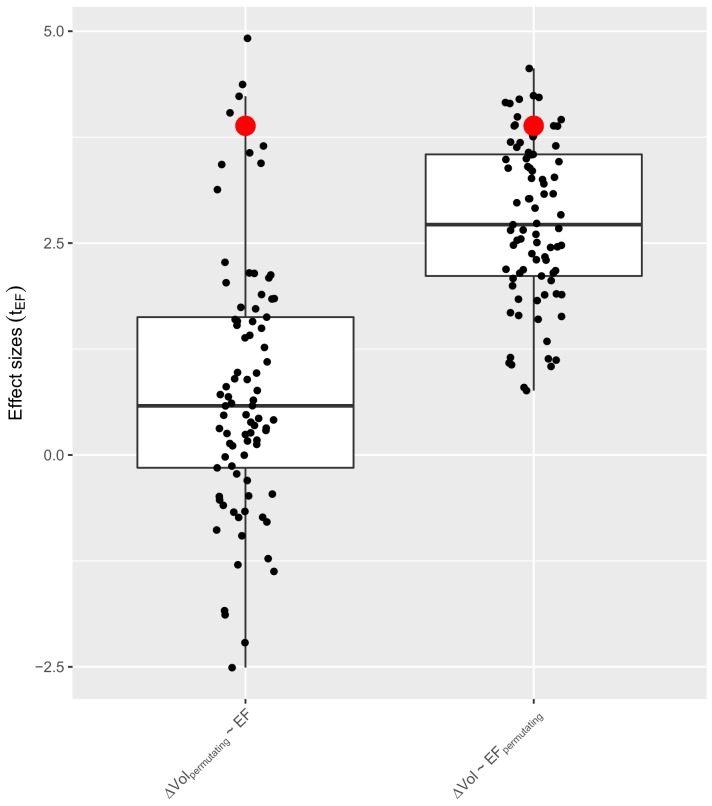
To test the specificity of our measures in the left amygdala (FDR corrected finding) we permutated the labels across the 85 ROIs, both for the volume changes (left) and for the EF values (right) and calculated correlations between the EF and volume change of these regions, respectively. This way we received 85 different values, where one of them was the ‘correct’ correlation, indicated with red dots. The ‘correct’ correlations between the EF and corresponding volume outperformed the other correlations (were in the top five percentile) from non-matching pairs, indicating that our findings were not merely a general correlation with some average values across regions, further strengthening the casual link between EF and volume change.
Figure 4—figure supplement 1—source data 1. Amygdala EF and volume change: permutation values.