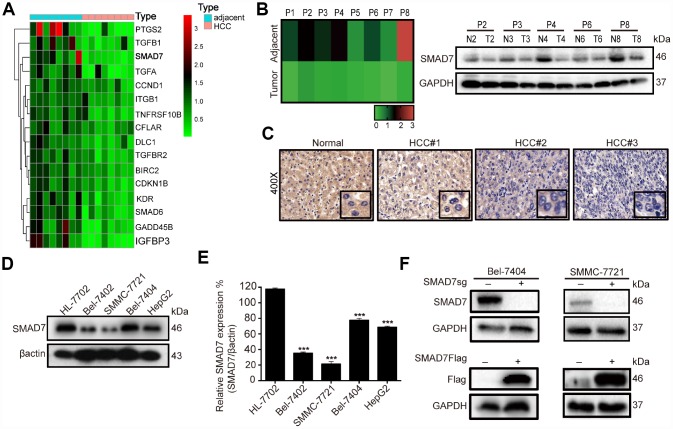
Figure 3.
SMAD7 is downregulated in liver cancer tissues and cell lines. (A) Microarray analysis of gene expression from RNA extracted in 8 paired human liver cancer tissues and matched normal liver tissues. (B) RT-qPCR assay detected the mRNA expression level of SMAD7 in 8 paired human liver cancer tissues (left panel). Western blot assay detected the protein expression level of SMAD7 in 5 paired liver cancer tissues which SMAD7 were differentially expressed (right panel). (C) Representative IHC images of SMAD7 staining in normal liver tissues and liver cancer tissues at 400Χ magnifications. (D) The SMAD7 protein level was analyzed in normal human liver cell line HL-7702 and liver cancer cell lines Bel-7402, SMMC-7721, Bel-7404 and HepG2 by western bolt assay. β-actin served as loading control. (E) Relative SMAD7 protein expression was calculated by the ration of SMAD7/β-actin in different cell lines from three independent tests. ***p<0.001 vs HL-7702. (F) The protein expression of SMAD7 in Bel-7404 and SMMC-7721 were analyzed by western blot with or without SMAD7-Flag or SMAD7-sgRNA virus infection. β-actin served as loading control.

