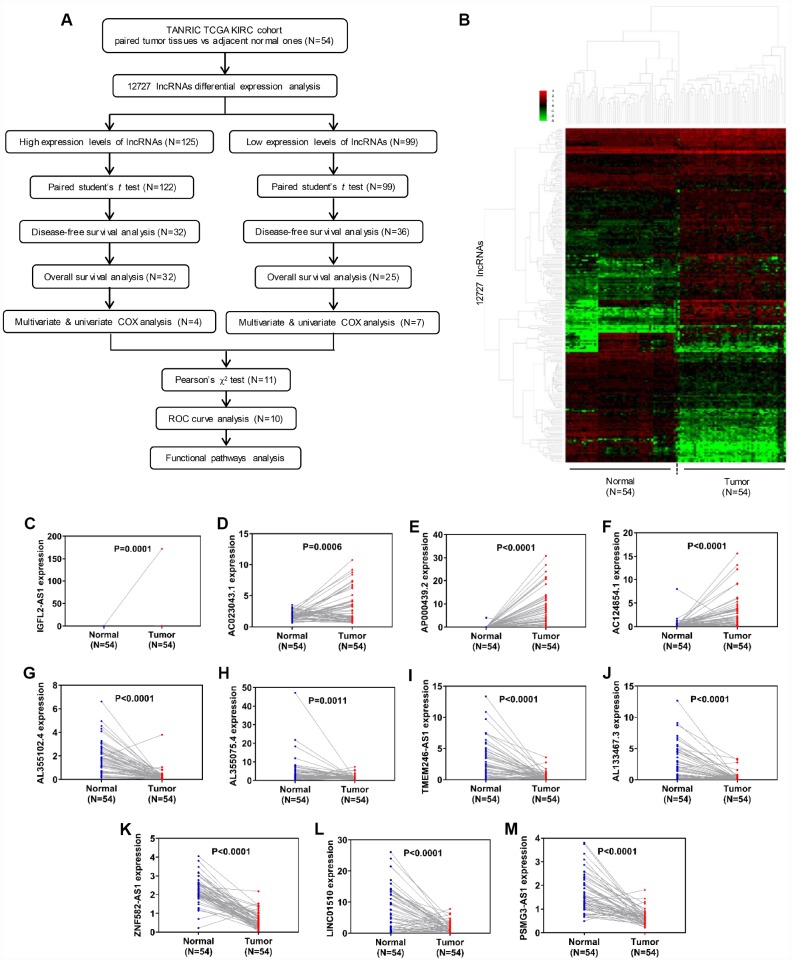
Figure 1.
Identification of differentially expressed lncRNAs in clear cell renal cell carcinoma. (A) Flow chart of study design. (B) Hierarchical clustering heatmap analysis of 12,727 lncRNAs with 54 paired samples from the TANRIC database. (C–M) Paired student’s t-test of candidate lncRNA relative expression between 54 paired normal and tumor samples. lncRNAs, long non-coding RNAs.

