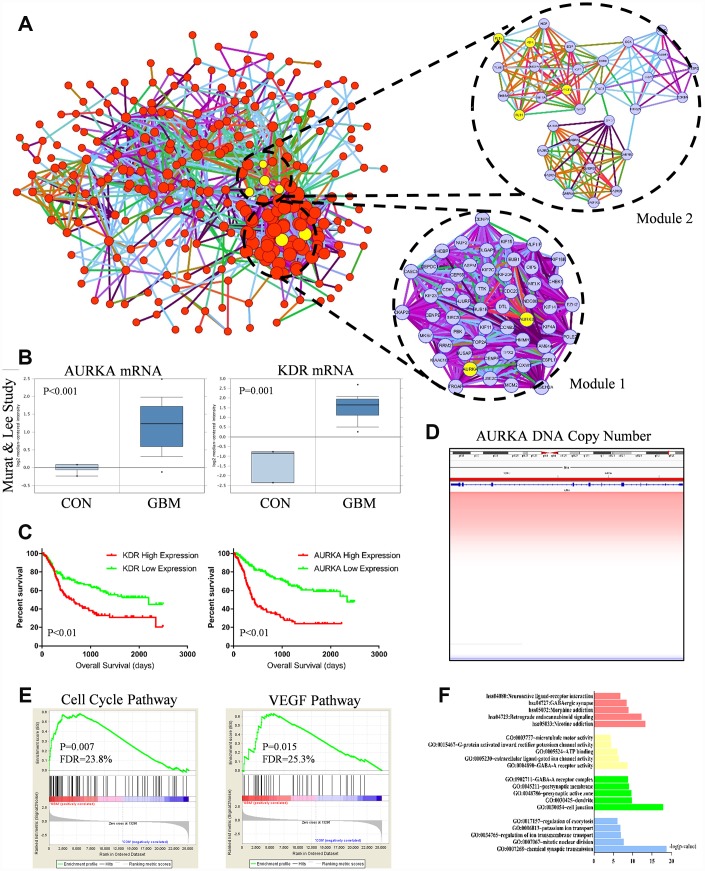
Figure 3.
(A) Protein-protein interaction (PPI) network of genes in the blue module. Every edge represented the interaction between two genes. Module 1 and module 2 were the top 2 modules from the PPI network. Yellow nodes noted hub nodes. (B) Based on the Murat and Lee study, AURKA and KDR mRNA expression were significant up-regulated in GBM tissues compared with normal brain tissue (p<0.01). (C) Kaplan-Meier estimated overall survival (OS) days in GBM patients. Left panel showed low-expressed KDR had significantly longer OS days (p=0.01). Right panel showed low-expressed AURKA had significantly longer OS days (p=0.01). (D) DNA copy number of AURKA. (E) Gene set enrichment analysis (GSEA) showed that cell cycle pathway (p=0.007, FDR=23.8%) and VEGF pathway (P=0.015, FDR=25.3%) were abnormally regulated in GBM tissues compared with normal brain tissue. (F) Functional and pathway enrichment analysis of genes in blue module.

