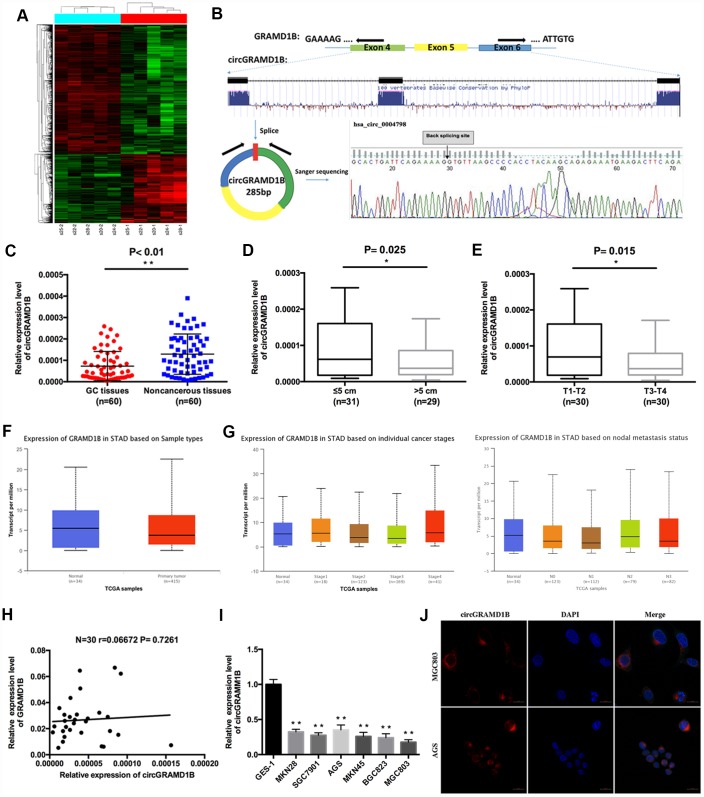
Figure 1.
Characterization of circGRAMD1B in human GC tissues and cell lines. (A) Clustered heat map showing tissue-specific circRNAs, which are displayed on a scale from green (low) to red (high), in five paired human GC tissues and paired noncancerous tissues. (GC tissues: s20-1, s22-1, s24-1, s25-1, s28-1; Paired noncancerous tissues: s20-2, s22-2, s24-2, s25-2, s28-2). (B) Schematic representation of circGRAMD1B formation. Arrows represent divergent primers that bind to the genomic region of circGRAMD1B. The splice junction sequence of circGRAMD1B was validated by Sanger sequencing. (C) The expression level of circGRAMD1B was detected by qRT-PCR in 60 paired GC tissues and noncancerous tissues. (D) qRT-PCR analysis showed that circGRAMD1B expression was lower in > 5cm GC tissues than in ≤ 5cm tissues. (E) qRT-PCR analysis showed that circGRAMD1B expression was lower in T3-T4 GC tissues than in T1-T2 tissues. (F) TCGA database analysis of GRAMD1B mRNA levels in human GC tissues (n=415) and normal tissues (n=34). (G) TCGA database analysis of GRAMD1B mRNA levels in different stages and nodal metastasis status of GC. (H) Correlation analysis of circGRAMD1B levels with GRAMD1B mRNA levels in 30 GC tissues. (I) Relative expression level of circGRAMD1B in GC cell lines and GES-1 cells using qRT-PCR assay. (J) Confocal FISH was performed to determine the cellular location of circGRAMD1B in AGS and MGC803 cells. (Values are shown as the mean ± standard error of the mean based on three independent experiments. *P < 0.05, **P < 0.01).

