. 2019 Oct 23;8:e49875. doi: 10.7554/eLife.49875

Figure 6. Protection against RhIV reinfection.

(A) RhIV viremia (log10 RNA copies/ml of plasma, upper rows) and blood CD4+ T-cell proportion (% of CD3+ cells, lower rows) in A1Ifnar-/- mice following infection with RhIVSF162 on days 0, 49 and 91. Each symbol type represents an individual mouse (n = 4). (B, C) RhIV viremia (log10 RNA copies/ml of plasma, upper rows) and blood CD4+ T-cell proportion (% of CD3+ cells, lower rows) in A1Ifnar+/+ mice (B) and A1Ifnar-/- mice (C) following infection with RhIVDu156, RhIVBG505, and RhIVSF162 on days, 0, 42 and 91, respectively. Each symbol type represents an individual mouse (n = 4). (D) RhIVBG505 and VSVMLV-E viremia (log10 RNA copies/ml of plasma, upper rows) and blood CD4+ T-cell proportion (% of CD3+ cells, lower rows) in A1Ifnar-/- mice following infection with RhIVBG505 on day 0 and day 28 (left panels), VSVMLV-E on day 0 and RhIVBG505 day 28 (center panels) or RhIVBG505 on day 0 and VSVMLV-E day 28 (right panels).

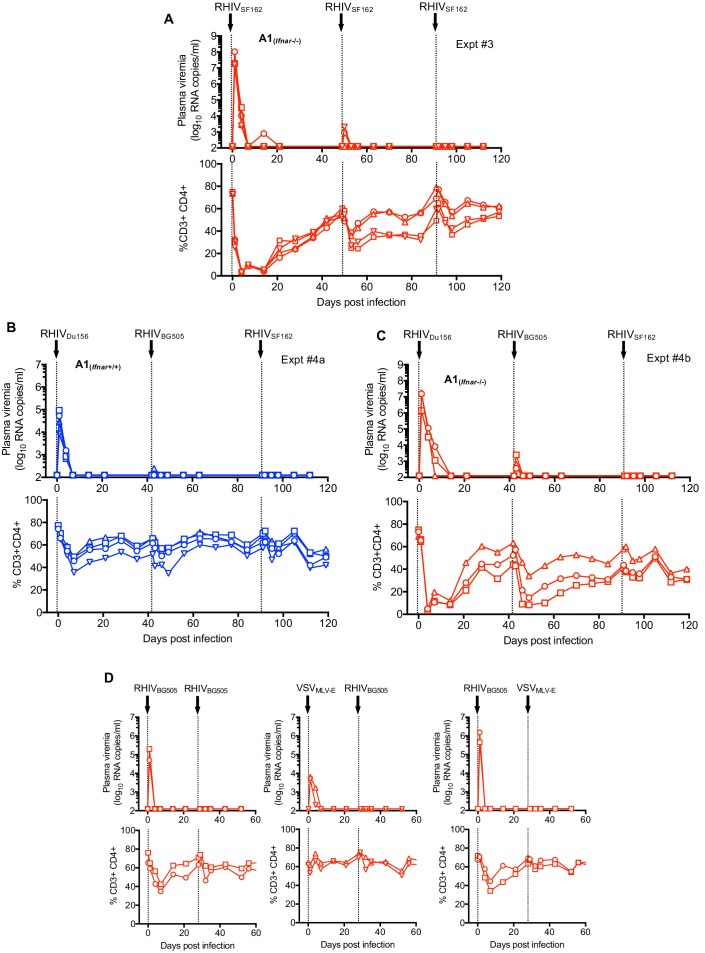
Figure 6.

Figure 6—figure supplement 1. Repeat infections of mice with homologous or heterologous RhIV strains.

Figure 6—figure supplement 1.

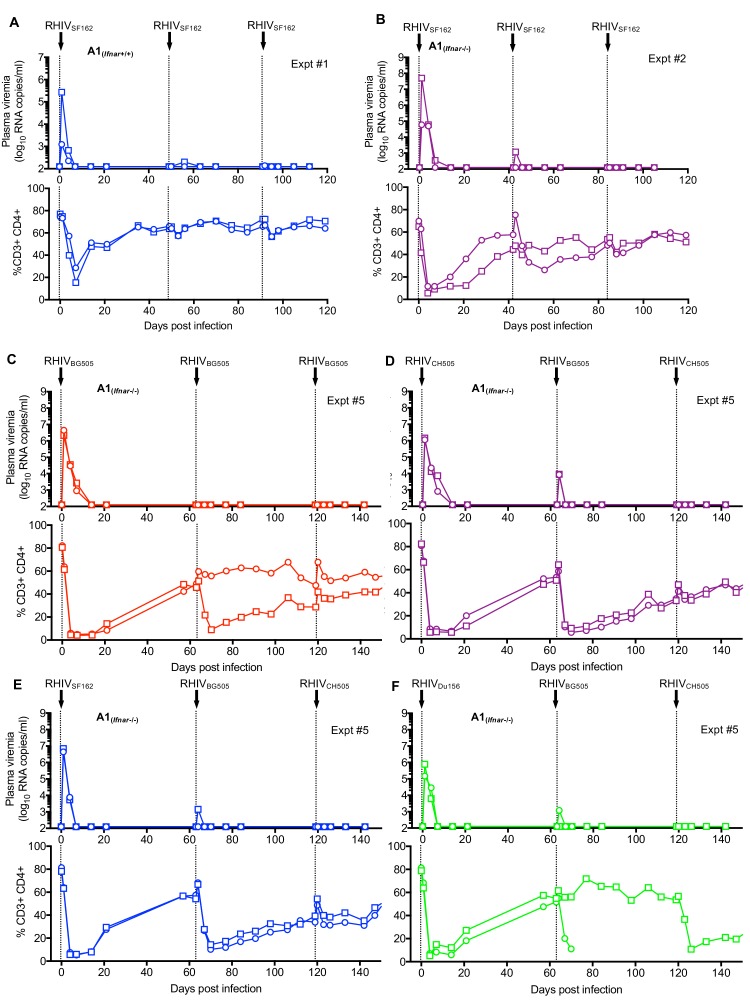
(A) RhiV viremia (log10 RNA copies/ml of plasma, upper rows) and blood CD4+ T-cell proportion (% of CD3+ cells, lower rows) in #A1Ifnar+/+ mice following infection with RhiVSF162 on day 0, day 48, and day 91. Each symbol type represents an individual mouse (n = 2). (B) RhiV viremia (log10 RNA copies/ml of plasma, upper rows) and blood CD4+ T-cell proportion (% of CD3+ cells, lower rows) in #A1Ifnar-/- mice following infection with RhiVSF162 on day 0, day 42, and day 84. Each symbol type represents an individual mouse (n = 2). (C) RhiV viremia (log10 RNA copies/ml of plasma, upper rows) and blood CD4+ T-cell proportion (% of CD3+ cells, lower rows) in #A1Ifnar-/- mice following infection with RhiVBG505 on day 0, day 63, and day 119. Each symbol type represents an individual mouse (n = 2). (D) RhiV viremia (log10 RNA copies/ml of plasma, upper rows) and blood CD4+ T-cell proportion (% of CD3+ cells, lower rows) in #A1Ifnar-/- mice following infection with RhiVCH505 on day 0, RhiVBG505 on day 63, and RhiVCH505 on day 119. Each symbol type represents an individual mouse (n = 2). (E) RhiV viremia (log10 RNA copies/ml of plasma, upper rows) and blood CD4+ T-cell proportion (% of CD3+ cells, lower rows) in #A1Ifnar-/- mice following infection with RhiVSF162 on day 0, RhiVBG505 on day 63, and RhiVCH505 on day 119. Each symbol type represents an individual mouse (n = 2). (F) RhiV viremia (log10 RNA copies/ml of plasma, upper rows) and blood CD4+ T-cell proportion (% of CD3+ cells, lower rows) in #A1Ifnar-/- mice following infection with RhiVDu156 on day 0, RhiVBG505 on day 63, and RhiVCH505 on day 119. Each symbol type represents an individual mouse (n = 2, one mouse died on day 68).
Figure 6—figure supplement 2. Construction of VSVMLV-E and Vaccine effect of RhIV infection does not require B-cells.

Figure 6—figure supplement 2.

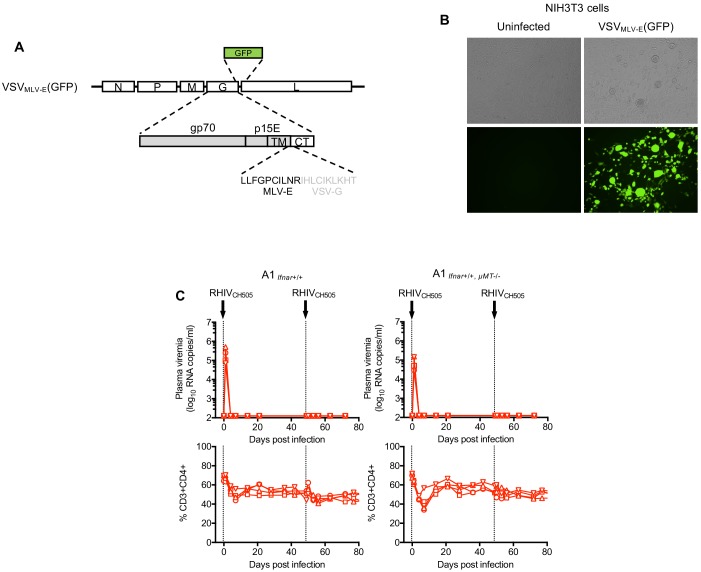
(A) Schematic representation of the VSVMLV-E genome in which the VSV-G ectodomain and transmembrane sequences are replaced with MLV-E Env counterparts and a GFP reporter is placed 3’ to Env coding sequences (B) Micrograph of NIH3T3 cells 24 hr after infection with VSVMLV-E(GFP). (C) RhiV viremia (log10 RNA copies/ml of plasma, upper rows) and blood CD4+ T-cell proportion (% of CD3+ cells, lower rows) in #A1Ifnar+/+ mice (left panels) and #A1Ifnar+/+, µMT-/- mice (right panels) following infection with RhiVCH505 on day 0 and day 49. Each symbol type represents an individual mouse (n = 4).
Figure 6—figure supplement 3. Gp160 (SOSIP) binding antibodies in RhIV infected mice (Expt #3 and #4).

Figure 6—figure supplement 3.

(A,B) ELISA measurement of antibodies that bind to plates coated with gp160 (SOSIP) proteins from BG505 (subtype A), B41 (subtype B), Du422 (subtype C) and Zm197 (subtype C) HIV-1 strains. Absorbance at 450 nm (A450nm) plotted against Log10 reciprocal serum dilution (A) Serum from Expt #3 A1Ifnar-/- mice infected with RhIVSF162 on day 0, day 49 (week 7) and 91 (week 13). Each symbol type represents an individual mouse (n = 4) and corresponds to the mice depicted in Figure 6A. (B) Serum from Expt #4a A1Ifnar+/+ mice (blue symbols/lines) and Expt #4b A1Ifnar-/- mice (red symbols and lines) infected with RhiVDu156 on day 0, RhiVBG505 on day 42 (week 6), and RhiVSF162 on day 91 (week13). Each symbol type represents an individual mouse (n = 4) and corresponds to the mice depicted in Figure 6B and C.
Figure 6—figure supplement 4. Gp160 (SOSIP) binding antibodies in RhIV infected mice (Expt #5).

Figure 6—figure supplement 4.

(A,B) ELISA measurement of antibodies that bind to plates coated with gp160 (SOSIP) proteins from BG505 (subtype A), B41 (subtype B), Du422 (subtype C) and Zm197 (subtype C) HIV-1 strains. Absorbance at 450 nm (A450nm) plotted against Log10 reciprocal serum dilution (A) Serum from Expt #5 A1Ifnar-/- mice infected with RhIVBG505 on day 0, day 63 (week 9) and day 119 (week 17). Each symbol type represents an individual mouse (n = 2) Symbols and line colors corresponds to the mice depicted in Figure 6—figure supplement 1C. (B) Serum from Expt #5 A1Ifnar-/- mice infected with RhiVCH505 on day 0, RhiVBG505 on day 63 (week 9), and RhiVCH505 on day 119 (week 17). Each symbol type represents an individual mouse (n = 2). Symbols and line colors corresponds to the mice depicted in Figure 6—figure supplement 1D.
Figure 6—figure supplement 5. Gp160 (SOSIP) binding antibodies in RhIV infected mice (Expt #5).

Figure 6—figure supplement 5.

(A,B) ELISA measurement of antibodies that bind to plates coated with gp160 (SOSIP) proteins from BG505 (subtype A), B41 (subtype B), Du422 (subtype C) and Zm197 (subtype C) HIV-1 strains. Absorbance at 450 nm (A450nm) plotted against Log10 reciprocal serum dilution. (A) Serum from Expt #5 A1Ifnar-/- mice infected with RhIVSF162 on day 0, RhIVBG505 on day 63 (week 9) and RhIVCH505 on day 119 (week 17). Each symbol type represents an individual mouse (n = 2) Symbols and line colors corresponds to the mice depicted in Figure 6—figure supplement 1E. (B) Serum from Expt #5 A1Ifnar-/- mice infected with RhiVDu156 on day 0, RhiVBG505 on day 63 (week 9), and RhiVCH505 on day 119 (week 17). Each symbol type represents an individual mouse (n = 2). Symbols and line colors corresponds to the mice depicted in Figure 6—figure supplement 1F.
Figure 6—figure supplement 6. Characterization of antibodies in RhIV infected mice.

Figure 6—figure supplement 6.

(A) INNO-LIA HIV I/II Score assay using sera from mice (Exp #5) Schematic on the right shows the position of the antigens deposited on each strip. Bands in the upper portion of the strips are controls for the presence of human serum and are not expected to react with mouse serum. Symbols and their colors above each lane correspond to the individual mice depicted in Figure 6—figure supplement 1. (B) Competition ELISA in which the indicated dilutions of IgG, purified from mouse sera, were tested for ability to block the binding of the indicated bnAbs to BG505 SOSIP.664 coated ELISA plates. Symbols and their colors correspond to the individual mice depicted in Figure 6—figure supplement 1.