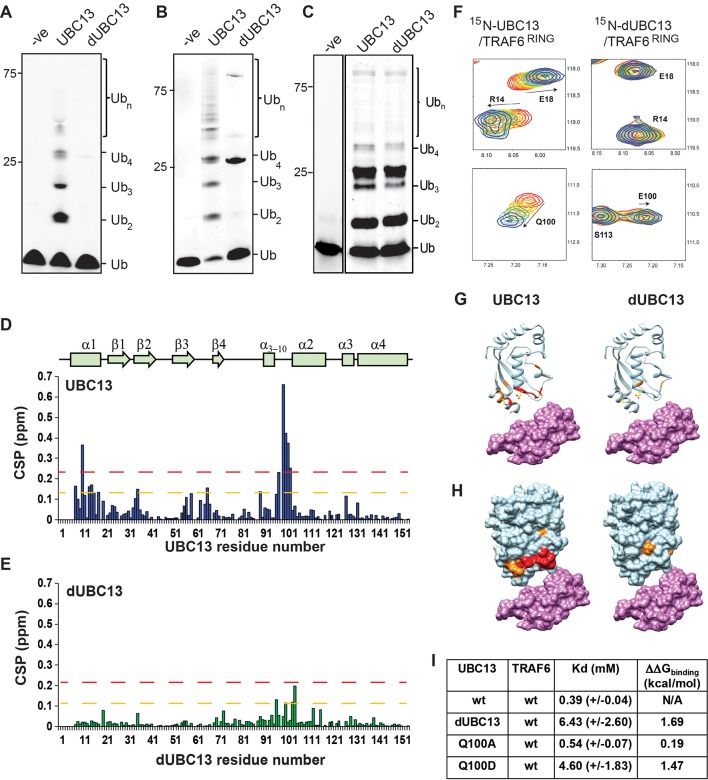
Figure 1. Interactions between UBC13 and TRAF6RING studied by NMR.
(A) In-vitro ubiquitination reaction was carried out using TRAF6RZ3 as the E3 and UBC13 or dUBC13 as the E2 for 10 min. Mms2 was used as a co-factor in the reaction. The –ve lane is the same reaction without ATP. (B) In-vitro ubiquitination reaction was carried out on GST beads for 10 min using GST-TRAF6RING as the E3 and UBC13 or dUBC13 as the E2. Mms2 was used as a co-factor in the reaction. The –ve lane is the same reaction without ATP. (C) In-vitro ubiquitination reaction carried out for 30 min using UBC13 or dUBC13 as the E2 and Mms2 as its co-factor. (D)The CSPs for residues in UBC13 upon binding to TRAF6RING. The chemical shift perturbations (CSP) between the free and the bound form are calculated as CSP = [(δHfree – δHbound)2+ ((δNfree – δNbound))2]1/2, where δH and δN is the chemical shift of the amide hydrogen and nitrogen, respectively. The orange and red dashed lines correspond to Mean + SD and Mean + 2*SD, respectively. The secondary structure alignment of UBC13 against its sequence is provided above the plot. (E) The CSPs for residues in dUBC13 upon binding to TRAF6RING. The dashed lines are replicated from (D). (F) Two regions of the titration HSQC spectra are expanded to show UBC13, but not dUBC13 peaks shift upon titration with TRAF6RING. Significant CSPs were mapped on the UBC13 and dUBC13 structure both in the (G) ribbon and (H) surface representation. The UBC13 and dUBC13 are colored in light blue. The residues with CSPs above Mean + SD and Mean + 2*SD are colored in orange and red, respectively. The surface of TRAF6RING domain shown in magenta. The UBC13/TRAF6RING complex is modeled from PDB 3HCU. (I) The measured dissociation constants of UBC13 and its mutants with TRAF6RING are provided as Mean+/-SD. The difference of free energy of binding was calculated as ΔΔGbinding = RTln(Kd/Kdwt), where T is 298K, and wt is the wild type complex.
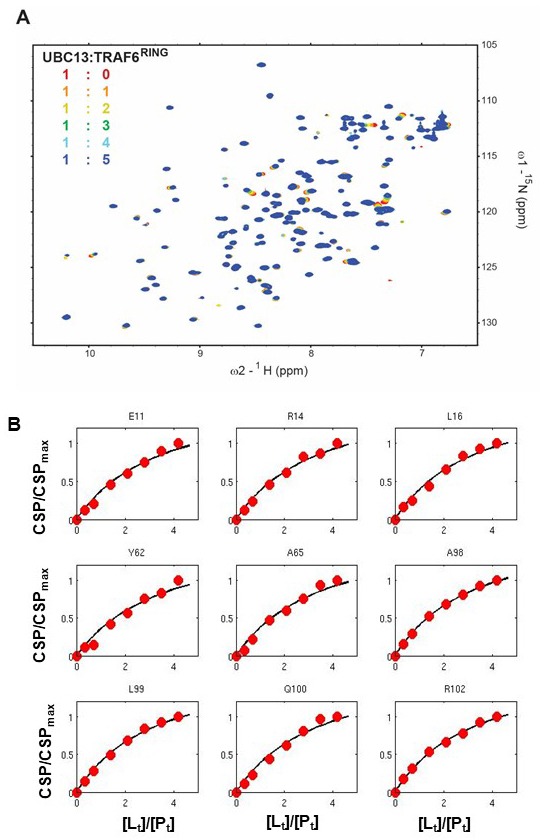
Figure 1—figure supplement 1. Binding studies of UBC13/TRAF6RING interaction.

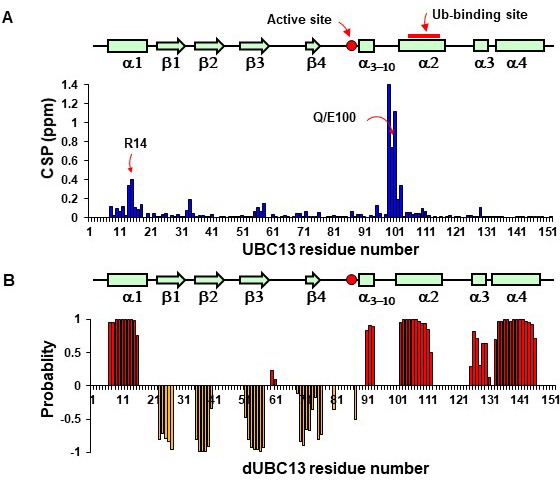
Figure 1—figure supplement 2. NMR studies of UBC13 and dUBC13.

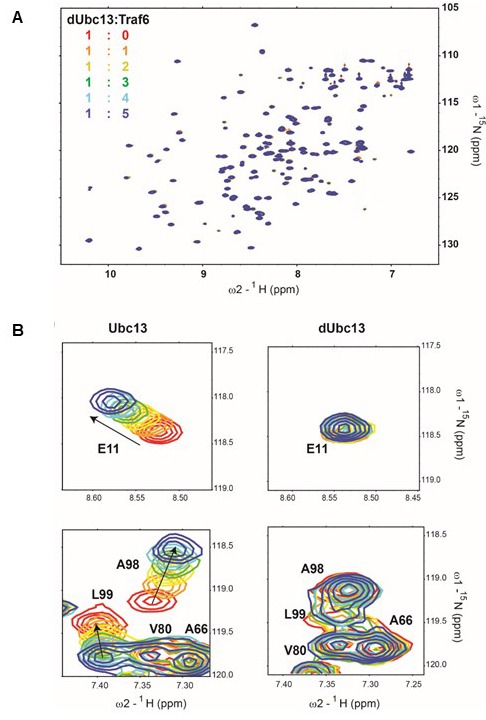
Figure 1—figure supplement 3. Binding studies of dUBC13/TRAF6RING interaction.


