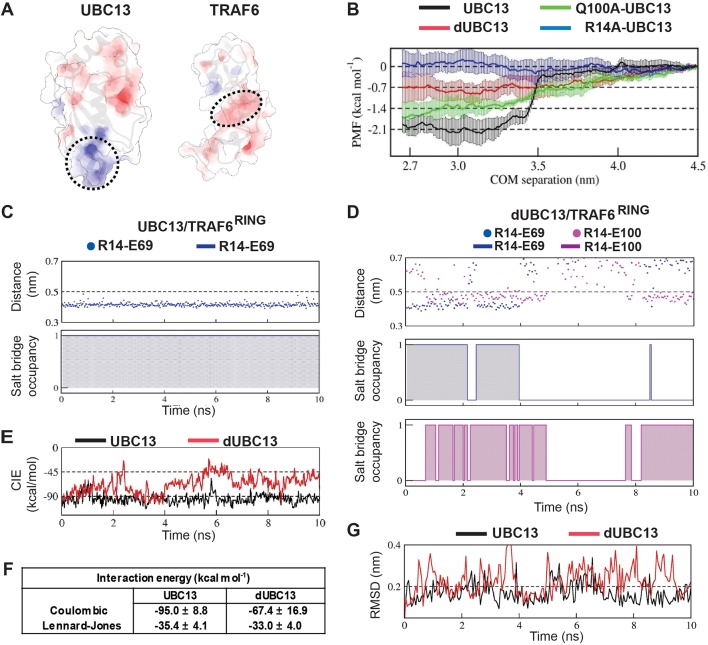
Figure 3. Deamidation induces salt-bridge competition to weaken UBC13/TRAF6RING interaction.
(A) Surface electrostatic potentials of UBC13 and TRAF6RING. Circled regions indicate the complementary electrostatic surfaces on UBC13 and TRAF6RING interfaces. The color scale ranges from −8 to +8 kT/e. (B) Potential of mean force (PMF) profiles as a function of COM separation along the x-axis for the association between UBC13 variants and TRAF6RING. PMF profiles were calculated by averaging over five PMF profiles ranging from 2.5 ns to 10 ns. Error bars represent ± one standard error of the mean (SEM). (C) Stability and occupancy of the R14-E69 salt-bridge in the native window for the wild-type complex. D) Stability and occupancy of the R14-E69 and R14-E100 salt-bridge in the native window for the dUBC13/ TRAF6RING complex. In (C) and (D), distance plots indicate the distance between R14 Cζ and E69/E100 Cδ atoms. The salt-bridge occupancy plots were generated as in Figure 2B. The salt-bridge occupancies are provided in Supplementary file 1-table S5. (E) Coulombic interaction energies (CIE) between UBC13 wild-type/Q100E and TRAF6RING in native windows (mean COM separation = 2.7 nm) from the US simulations. The table in (F) reports the Mean ± SD of the interaction energies over 10 ns. (G) RMSD of TRAF6RING (aa:70–109) against time in the UBC13 and dUBC13 complexes.
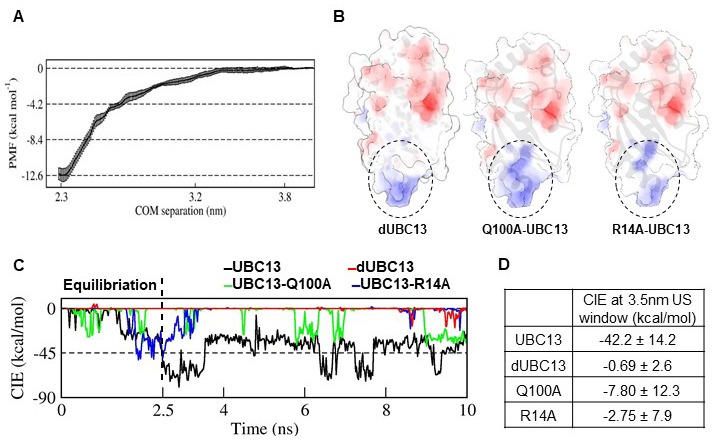
Figure 3—figure supplement 1. PMF profile for the Barnase-Barstar complex and CIE calculations for the UBC13 complexes at 3.5 nm US window.


