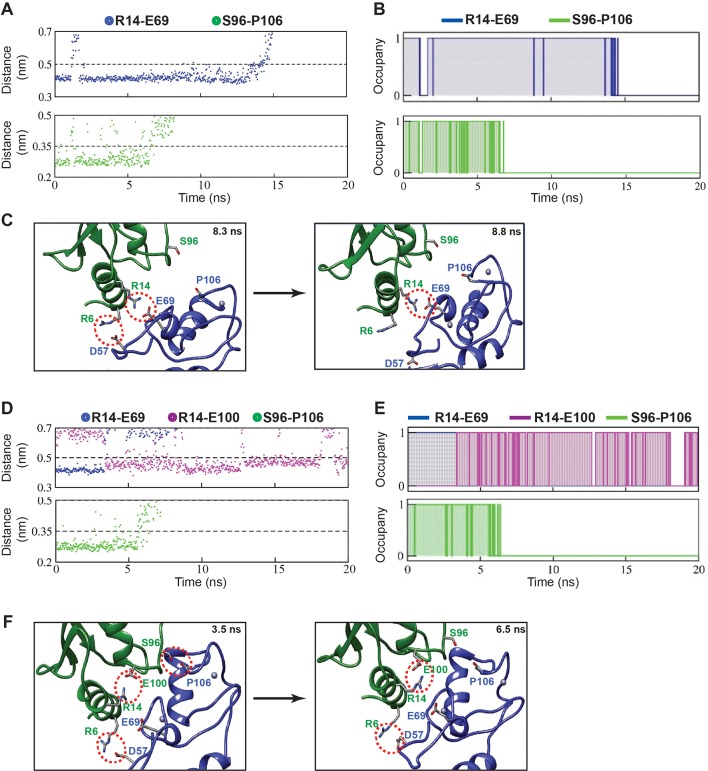
Figure 5. Pathway of UBC13/TRAF6RING complex dissociation from steered MD.
(A) Top: The distance between R14-Cζ and E69-Cδ atoms against time during SMD. Bottom: The distance between S96-Oγ and P106-O atoms against time during SMD. (B) Occupancy plots of (A) calculated as in Figure 2B. (C) Two snapshots from the trajectory in (A) are shown. S96-P106 contact is disrupted at 8.3 ns followed by the R6-D57 salt-bridge break at 8.8 ns. Red dotted circles indicate the polar contacts. (D) Same as (A) for the dUBC13/TRAF6RING complex. The distance between R14-Cζ and E100-Cδ atoms against time is added here. (E) Occupancy plots of R14-E69 (blue), R14-E100 (magenta) and S96-P106 (green) contacts for the dUBC13/TRAF6RING complex. (F) Two snapshots from trajectory analyzed in (D) showed competition between R14-E100/E69 salt-bridges as the complex starts to dissociate at 6.5 ns.
Figure 5—figure supplement 1. Dynamics of R6-D57 salt-bridge and hydrophobic interactions in SMD.


