Figure 6. Analysis of transient complexes formed in the US simulations.
The US window corresponding to 3 nm COM distance of separation was analyzed. (A) The transient complex of UBC13 and TRAF6RING at t = 2.50 ns is shown. A transient intermolecular salt-bridge between R14 and D57 is indicated by a red dotted circle. (B) The plot of COM separation against time for the UBC13/TRAF6RING and dUBC13/TRAF6RING complexes. (C) The distance between the R14-D57 transient contact is compared between the two complexes. The distances were measured between R14-Cζ and D57-Cγ atoms. (D) Coulombic interaction energy (CIE) plotted against time. (E) The contact distance of E100-D57 and R14-E100 contacts are shown against time for the dUBC13/TRAF6RING complex. The distances were measured between R14-Cζ, E100-Cδ, and D57-Cγ atoms. (F) The transient complex of dUBC13 and TRAF6 at t = 0.35 ns, where E100 contacted D57.

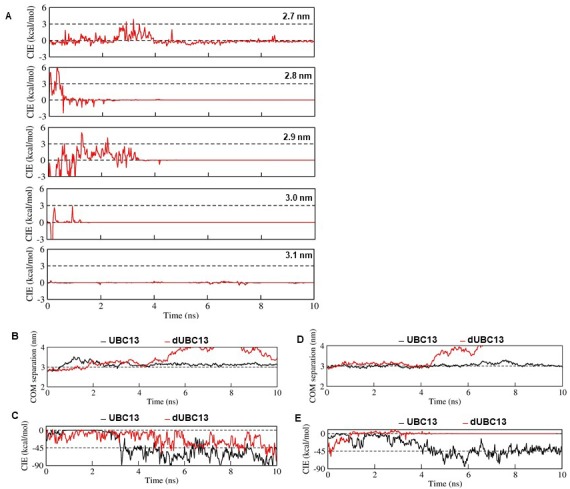
Figure 6—figure supplement 1. Analysis of interaction energy and COM separation between UBC13 and dUBC13 complexes from multiple umbrella sampling windows.